Showing posts with label GDP. Show all posts

Monday, 9 July 2018

Trumponomics Good For Ireland (So Far)

Irish Exports to US up € 1 billion in 2017 


Export figures published by the Central Statistics Office show that Irish exports to the USA since Trump was sworn in as President in January 2017 were up €1.1 billion (3%) from 2016 to €33 billion. And compared to 2015, Irish exports to US have shot up by 23%, a total increase of € 6.2 billion.

The biggest increases were in dairy, cereals and other food products, beverages, textiles, medical and pharmaceutical products, power generating machinery and manufactured articles. 

Trump's "America First" policies of tax cuts, reduced regulation and energy independence have led to increased investment and economic growth in America. This in turn means that America have imported more goods from Ireland. Some commentators warned that the opposite could happen - that USA would become more isolated and less dependent on imports - but the reality is that people living in strong performing economies purchase more goods, including imported goods.

USA remains Ireland's largest exporting market. The impact of Trump's tariffs is not known yet. He has also attempted to lure FDI back to America.


Friday, 24 February 2017

Ireland's Debt Problem

An economic policy based on rising debt and low corporate tax rates is not and never was sound policy - by Owen Martin

While the Irish media make a fuss over who will be the next leader of Ireland's biggest political party (Fine Gael), everybody ignores the real elephant in the room. According to the European Banking Authority, Ireland has the largest combined private and government debt as a percentage of GDP in the EU and two thirds higher than that of the US. 


 I'm not sure how this graph is not sending shockwaves through the Trump obsessed Irish media and political establishment - From EBA 


While Greece, Italy and Portugal have higher Government debt, Ireland's private sector debt to GDP dwarfs those countries. Which means that for the size of Ireland's economy, it's private sector has taken on alot of debt.

But not only businesses and industry. We have the 5th highest household debt as percentage of net disposable income in EU with about twice as much debt as income per household. This may explain how we rank so high in numbers of new cars across the EU.   People are taking out car loans that perhaps they can't really afford. It shows that we as a nation are still addicted to debt.


Denmark, Netherlands, Iceland and Norway all have higher household debt than Ireland but these countries are doing much better when it comes to Government debt as percentage of GDP. Ireland ranks 5th in terms of Government debt to GDP. So while Greece and Italy have higher levels of government debt, they have about half of the household and private sector debt. Denmark's high level of household debt doesn't seem as bad considering they have half of Ireland's Government debt to GDP. 


Norway have the wealthiest government in Europe. In fact, they are far ahead of second place Luxembourg and Finland. Norway has slightly more household debt than Ireland. But that kinda makes sense - they are a wealthy country. Ireland has the 5th poorest Government in Europe (Italy and Greece lie at the bottom). Our government has dismal revenue, in part thanks to our low corporation tax rates. Yet we carry roughly the same household debt as Norway and have an even higher private sector debt to GDP.  This is called "living beyond our means".  Yes, Ireland could do with the € 13 billion in tax revenue owed from Apple. Laughably, the Irish government is appealing this decision


Irish Govt has the worst revenue in Europe yet reject a €13 billion EU tax ruling made in Ireland's favour

Of course if all that debt was used wisely, perhaps we could become richer. We are reliant on Norway's gas which arrives to us through UK pipelines. The Irish government have banned fracking so this dependence will continue for the foreseeable future. Imagine if some of that debt was being used to extract our own gas reserves.


Ireland spends the most on health after Iceland in Europe, yet we still have a permanently dysfunctional health system

Ireland has the third highest electricity prices in Europe.

The Irish government takes pride in divesting from fossil fuels and pushing through massive renewables and electricity infrastructure programmes that cost billions and without any proper assessment in the name of climate change.  We pride ourselves on having a massive welfare program and our representatives want to take in more refugees (without any proper assessment). Green/Left politicians cry out as to why we don't do more to tackle climate change, take on more debt (One cannot go the EIB looking for €5 million or €10 million; one needs to go looking for €2 billion. It is there.) and take in more refugees. Ireland is trying to save the world on a sinking ship but our politicians and media don't even realize we are on one.  Have we learned anything from the crash in 2008 ?


POSITIVES


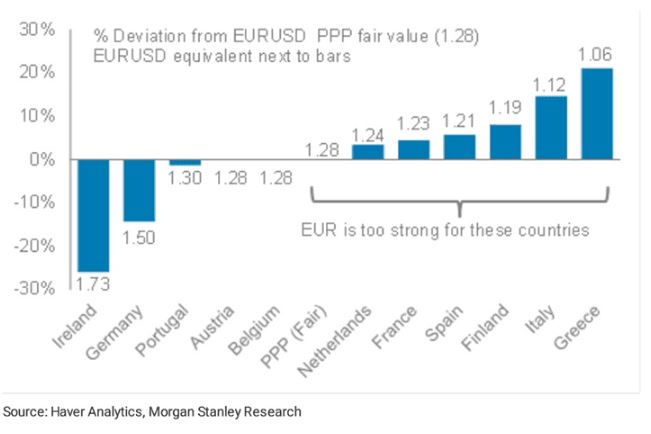
On the positive side, exports are still strong and benefit from the stronger dollar as against the euro. If we went back to our own currency, it would be a strong one as the above graph shows. Presumably thanks to our exports. However, the weaker sterling is not good for exports to Britain. There is a chance that Ireland may actually benefit from Brexit if companies there relocate to Ireland. 


https://data.oecd.org/gga/general-government-deficit.htm#indicator-chart


Ireland has managed to get out of it's budget deficit abyss and back to something fairly normal. If Multinationals move out we could see some real problems, but we would no longer see the massive distortions to our GDP anymore. Perhaps that could be a good thing in the long run. Living on a false economy (now known as Leprechaun economics) is what got us into trouble last time.

I can't see how Ireland's economic fundamentals are much different to that of the Celtic Tiger era.   If anything, things have got worse.

Sunday, 12 February 2017

Price of Electricity and Renewables Revisited

Previous work by Willis Eschenbach and Euan Mearns showed the relationship between Electricity costs and per capita installed renewable capacity. A new European Commission report shows the increases in electricity prices since 2010. I put this on a graph alongside the increase in share of electricity from renewable sources [Figure 1].


Figure 1 : Increase in electricity prices 2010-2015 plotted alongside increase in share 
of renewables in electricity generation 2010-2014

So the UK went from renewables providing 7% of electricity generation in 2010 to 17% in 2014 resulting in almost a 50% increase in prices over the same period. Ireland is in the top five increases in electricity prices over this period. Denmark seems to be an outlier (although they started off from very high prices) but most countries who invested heavily in renewables saw a sharp rise in electricity prices. 

Something that struck me was the proliferation of PIIGS countries at the top of the graph. So I labelled the top government indebted countries on the same graph [Figure 2] :


Figure 2: Top 7 member states with highest Government debt as % of GDP 


Greece, Italy and Portugal are the top 3 indebted countries in the EU (Debt of general government, as a percentage of GDP). Most of the countries investing heavily in renewables are also running up the biggest fiscal deficits. They have put environmental sustainability above economic sustainability. However, surely the two are linked ? If capitalism is the driver of climate change then living beyond your means must be twice as bad.


References
_________________


1)  Monitoring progress towards the Energy Union objectives – key indicators - see Page 62
https://ec.europa.eu/priorities/sites/beta-political/files/swd-energy-union-key-indicators_en.pdf

2)  Share of electricity from renewable sources in gross electricity consumption (%) - unfortunately this only goes up to 2014, whereas the prices in 1) goes up to 2015, so if a more recent report comes out I will update this blog. Still, Figure 1 is indicative of the electricity price/ RES-E trend.

3)  Risk Assessment of the EU Banking System - See Figure 1