Showing posts with label CO2 intensity. Show all posts

Tuesday, 10 March 2020

Does Wind Energy Reduce CO2 Emissions ?

There has been a lot of coverage recently about how much wind energy is contributing to the electricity grid, but how much CO2 is it really saving ?

The graphs below, based on data from eirgrid dashboard, show that on some days there is absolutely no savings at all.

The two days being compared are 23rd January 2020 and 29th of November 2019. Note that wind generation (blue) on 29th November is over 7 times that of 23rd January 2020 but CO2 emissions (in yellow) are virtually identical.


East West interconnector (in green) minus figures are exports, pluses are imports. At 329 grams CO2 on both days EWIC imports are very close 84 and 81 MW on the 23rd January 2020 and 76 and 1 MW 29th of November 2019 (circled). However, even though wind output is over 5 times higher on the 29th November, CO2 emissions remain static at 329. 

This raises serious questions about the effectiveness of wind energy in the irish grid. 

Thanks to John Dooley for providing the graphs. 

Wednesday, 29 March 2017

The Impact of High Levels of Wind Energy on Conventional Plant

On Wednesday 25th January 2017 wind energy reached a new record of 2,400MW for the Republic of Ireland. This post will look at the impacts on some of the other generation sources.


CCGT ( Gas)


Only three out of eight CCGT ran during the day - two in Dublin (Poolbeg and Dublin Bay) and one in Cork (Whitegate). Presumably, the other 5 plants were paid capacity or constraint payments to shut down for the day.

Wind generation was unusually stable during the day and so Dublin Bay and Whitegate mostly followed demand while the output from Poolbeg had a flat profile. Dublin Bay ran the most efficiently. Whitegate's output hovered between 45% and 60% of it's maximum (or rated capacity otherwise known as load). Poolbeg, on the other hand, operated at about a quarter of it's rated capacity. Operating a CCGT at this level leads to higher specific emissions and fuel consumption, something like driving your car in second gear all the time. 

It would have been therefore preferable to have operated Whitegate on higher loads and take Poolbeg off the grid altogether. The requirement for two power stations to be on load at all times in the Dublin area probably lead to this less than ideal situation.


Coal 


Two out of the the three generators at Moneypoint operated for the day and like the CCGT mostly followed demand.   They operated at an average of 50% of maximum output with minimum output at 40%. A load of 40% capacity is likewise not exactly ideal in terms of efficiency. 


Peat


The three peat power stations are being run on baseload and as a result are not affected by high wind levels. The biomass component seemed to be out of action. The question arises as to why (like wind) peat still receives a subsidy if it is always allowed to operate in the electricity generation market (Though I think the peat subsidy is being phased out). 


OCGT (Gas)


Both open gas cycle units at Sealrock operated at close to full output for the day as like wind they have priority dispatch in the system.


Demand Side Units (DSU)


One relatively new problem for Eirgrid is that despite having all this additional generating capacity in place, matching supply with demand is not as straightforward as previously thanks to the presence of stochastic wind energy. Fast acting plant is one answer to this. Another solution is reducing demand during periods of high demand. Demand side units reduce the demand during peak times giving industrial users a choice to shut down production or use their own diesel generators. 

As more wind is added, more reliance will be placed on DSUs and ironically diesel generation. During this day, on average 18MW per hour of DSU was called on to help keep the lights on. Not a significant amount at this stage. But according to Eirgrid :


The capacity of Demand Side Units in Ireland has increased to 230 MW, and is set to increase further. 


East West Interconnector to UK (EWIC)

The UK interconnector played a crucial role on this day. For most of the time, Ireland sent across it's surplus wind but for an hour, between 6pm and 7pm, Irish generation was insufficient to meet the rise in demand as people arrived home from work and turned their kettles and cookers on. It's an unfortunate fact that you can't "switch the wind on". Also you can't simply switch a large power station like a CCGT on. 

The preferred solution by Eirgrid, presumably because it was cheaper than the other option discussed below, was to reverse the direction of electricity in the interconnector. However, the UK was strapped for generation at this time and (incredibly) France were reliant on UK imports. A precarious situation for the UK but 120MW of spare power for Ireland is not a significant amount for a system of their size.


There is still a shortfall of about 200MW at peak time (where blue line is higher than orange line in the second graph above) which I'm not sure how they made up. Possibly more hydro or DSU or some other peaking plant that I may have missed.

The other option available to Eirgrid would have been to simply increase output from Poolbeg as the demand began to rise. After all, it was being operated at well below optimum efficiency as discussed above.  This is presumably what would have happened if there was no interconnector. Usually the low cost of power purchased from UK would make importing a cheaper option but I can't imagine a grid with such a tight capacity margin as the UK's giving away low cost power during peak demand times. But I can only assume it was somehow cheaper in this case.


The power UK sent to Ireland was made up mainly of gas and coal generation with some nuclear and wind : 


The generation mix for the day is given below  :


Saturday, 5 December 2015

Storm Desmond - the problem with too much wind energy in one graph

Forecasted Wind energy output for 6th December, the day after Storm Desmond, shows a loss in wind generation of 91%

As I write, Storm Desmond is raging outside my window and wind energy output is providing almost 50% of demand. It is coming at a price, however, with ESB Networks reporting that about 12,000 customers had to go without power today due to damaged cables. But electricity is not just required on a Saturday, it is required every day. According to Eirgrid forecasters, wind energy output is forecast to drop by as much as 91% tomorrow, from nearly 2,000MW to 160MW over 16 hours. (a drop in capacity factor from 87% to just 7%)

This explains why wind has such a low capacity credit. Let's look at what Eirgrid had to say in 2009 :

However, the benefits [of wind energy] tends towards saturation as wind penetration levels increase. This is because there is a significant risk of there being very low or very high wind speeds simultaneously across the country. This will result in all wind farms producing practically no output for a number of hours (note that turbines switch off during very high winds for safety reasons). In contrast, the forced outage probabilities for all thermal and hydro units are assumed to be independent of each other. Therefore, the probability of these units failing simultaneously is negligible [Eirgrid 2009].

What they mean is that a gas power plant (CCGT) of 400MW might drop out but will do so independently of another gas plant. So that would be a loss of 400MW which standby reserve would adequately replace. But wind farms do not act independently of each other.  Instead, when one drops out, chances are the rest of them will aswell. So now you have a huge hole in generating output of about 1,900 MW, equivalent to about 50% of tomorrow's demand. So you need to have about 5 large gas plants ready to step in. Starting these type of plant up from "cold" is not a good solution as engineers have stated that this is 20 times more damaging to plant than "warm" starts. It is also very expensive and high emitting in pollutants. So gas plant are kept running on low load behind the wind and will then step in tomorrow to pick up the load as wind slackens off. 

Eirgrid are lucky in that the wind is forecast to decline over a period of 16 hours. What would happen if they are wrong and it falls off at a quicker rate ? Then they may need more fast acting plant like diesel or open gas cycle turbines. These are more polluting than efficient CCGT type plant and will result in higher emissions, thereby negating some of the benefits of having all this wind generation. 

Can we close down any of our power stations and replace it with a huge fleet of wind turbines ? Can we really make a transition to a more sustainable "green" based energy supply ? 

As you can see from the above, the answer is no, not with wind farms.

Thursday, 27 November 2014

Dublin Electricity Generation - An Analysis Part 2


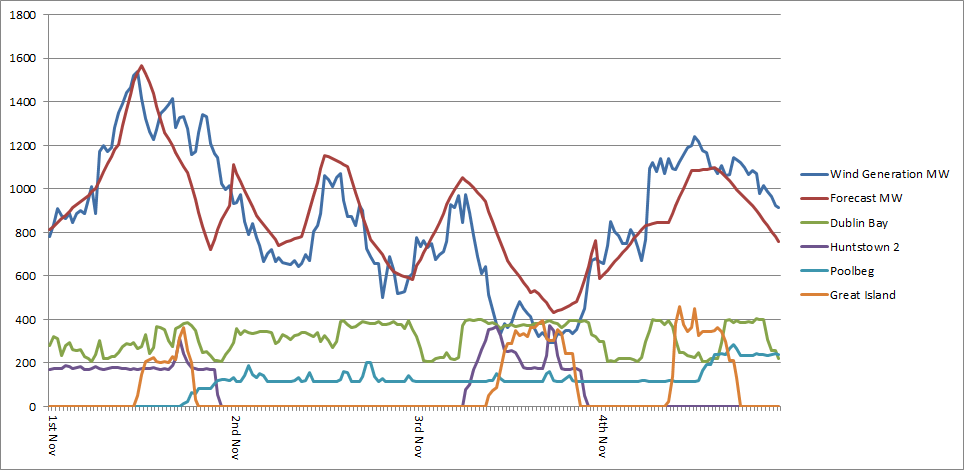
In Part Two, I will take a closer look at Poolbeg and Dublin Bay CCGT over the same period as Part 1 - 1st November to 4th November, 2014. In Figure 1, these are the green and blue lines along the
bottom :

Figure 1: Total Wind Generation and Forecast for the Republic (Eirgrid) and Profiles of Dublin Generators (SEMO) 
1st Nov - 4th Nov, 2014

Before I proceed, a little explanation on the operation of CCGT (combined cycle gas turbine) is required. This type of plant is the most efficient for converting gas into electricity. It is basically a gas turbine, such as what is in an airplane. But unlike the gas generators of old where the steam is released into the sky through a stack, the CCGT converts the steam into electricity aswell. We can see from the following graph what the efficiency is like at various output / loads:

9
From http://www.thermalplant.com

So for instance, a plant on full load producing 400 MW, a typical Irish CCGT, will have an efficiency of about 58%, but when throttled back to 200 MW, the efficiency has dropped to 50%. While the curve is not continued below 50% loading on the plant, it is in fact a steeply dropping curve, such that at 100 MW (33% load), the efficiency is less than 40%.

In other words when running a CCGT at 33% load you need to burn 2.5 MW of gas to generate 1 MW of electricity. If you ramp back up the power station to 100% load, you only need to burn 1.7 MW of gas to produce the same 1 MW of electricity. This means effectively that by operating the CCGT at one third of its design load, the unit gas consumption has gone up by 50%.

The same can be seen in the carbon dioxide emissions in Figure 2. When the CCGT power plant is operating at full throttle, the carbon dioxide emissions are as low as 0.35 tonnes per MWh (350 g/kWh), but start to rise rapidly as the output of the plant is reduced. 

19
From http://www.thermalplant.com


So bearing this in mind, we now come to Dublin Bay and Poolbeg.

Dublin Bay CCGT


Dublin Bay is a 415MW gas plant. Figure 2 compares the load profiles for Dublin Bay for a period with no wind in October (9th to the 12th), and the above high wind period in November.

Figure 2: Dublin Bay operating at different loads

We can see that it was operating at close to full load, producing around 390MW (95% load), during the period in October. According to a recent EPA report, Dublin Bay has an efficiency of 56.97%. So to produce about 390MW of electricity, 680MW of gas was consumed. In November, when high winds moved across the country, we can see that there was alot more cycling, particularly in the first two days. When it ran at 50% load in November, its efficiency was about 50% or slightly below. So to produce 200MW, roughly 400MW of gas was consumed. So there was a fossil fuel saving in the region of 280MW when operating at 50% load as opposed to 95% load, but there was also a corresponding rise in emissions of circa 0.05 tonnes per MWh. These savings don't take into account any increase in reserve that may have occurred during the period of high winds. This information is unavailable unfortunately.

Engineers in the trade are now realizing that this increased cycling is not something that is without consequence. Gas power plants evolved over the years from pretty lousy efficiency to a very high degree of efficiency in modern times due to the great ingenuity of engineers. These advances are now been undone by the high levels of wind energy been allowed into grids across Europe and elsewhere. As posted in a previous blog , German engineers are now claiming:

"that existing plants are not technically laid out for the operational requirements of today, which naturally is being altered due to the highly intermittent input of increasing amounts of solar and wind energy on to the grid. This rapid increase in renewables in recent years in Germany has put operational demands on existing gas and coal power plants, which are simply not technically designed for it. The plants must be more frequently switched on and off in order to be able to compensate for the fluctuations, which are associated with electrical inputs from sun, wind and water. The degree of load change is partly more than 200 times higher than that permissible for the power station. As a result the danger of lasting damage to the power  plants grows – along with increasing risks to the security of electrical supply."

So who will pick up the tab for the increased maintenance of these generators that will result ? Well, ESB, a semi state company, owns Dublin Bay, so the answer is the Irish taxpayer.  The Irish people part own a very expensive asset in Dublin Bay, one of the most efficient plants in the country at generating electricity, now been run increasingly like its inefficient ancestors of old. It's akin to buying a brand new car and driving it in second gear on a motorway. So there is a trade off between the fossil fuel savings from wind and the inefficient operating of plant. Of course, if wind could replace the plant in its entirety, then the problem would be solved.

Poolbeg CCGT


Poolbeg is a 463MW gas plant also operated by ESB. However, it is not a modern CCGT like Dublin Bay, but rather an older model. Therefore it has a lower efficiency - 46% according to EPA. Figure 3 shows the different load profiles during the period of high winds in November and the same period above in October with low winds :

Figure 3: Poolbeg CCGT different load profiles

During the period in November, Poolbeg was ramped down to 25% to allow the high wind penetration into the system. Its normal position is seen in the blue line during the period in October, where it sits at circa 50% and ramps up when there is additional demand. Because demand has fallen in recent years, there is no longer a need for all the extra capacity in the Dublin region and so Poolbeg (which has to run to maintain voltage) runs on half load most of the time. (by the way, average Demand over the two periods in this study is almost identical). So during the low wind period, the efficiency of the plant is circa 42% based on an average load factor of 58%. This results in average fuel consumption of 550MW to generate 230MW of electricity. But during the period of high wind, with a load factor of 25%, the efficiency of the plant has now fallen off a cliff, exacerbated by the fact that Poolbeg is not an efficient modern CCGT plant to begin with. So the efficiency in this case is circa 20%, meaning that fuel consumption is in the order of 574MW to generate 115MW of electricity. So the plant actually consumed more fuel when the high winds moved over the country - See Figure 4.
Figure 4 : Poolbeg CCGT fuel consumption - ramping down to low loads can lead to increased fuel consumption and
CO2 emissions


Likewise, the CO2 emissions were greater during the high wind period which brings up the issue as to  whether the EPA should be monitoring and doing something about situations like the above. 

So it can be shown that very high winds can lead to an increase in emissions and fuel consumption -   the very opposite of what was intended - what is known as "the law of unintended consequences". 
While there was a fuel saving in Dublin Bay (when one discounts the emissions involved in the         installation and manufacture of wind turbines), there was fuel and emissions cost in Poolbeg.
There is also potential maintenance problems that may result for both plants - with ESB and the           taxpayer / consumer picking up the tab.

This is another problem that will be exacerbated when more wind is added to the system. As already   pointed out, two of the large gas power plants in Dublin have to run at all times and can't be shutdown regardless of how much wind energy is generated. So these plants will be forced to increasingly ramp down to even further lower loads, further increasing fuel consumption and emissions. This proves that wind energy is only of any use at low penetration levels unless there is large levels of hydro in the system such as in Scandanavia (and even there, they have to export a large proportion of their wind output).


Sunday, 2 November 2014

No CO2 emissions savings since 2011

Data from Eirgrid shows average CO2 levels haven't changed despite new wind capacity


Eirgrid publish CO2 emissions and CO2 intensity levels every quarter hour for the Irish system. When the data is extracted for the last three years, the results show, that on average, there has been no reduction in CO2 emissions from electricity generation. As can be seen in the first graph below, about 290MW of installed wind capacity was added to the system between 2011 and 2013. The capacity factor of wind (a higher percentage means higher winds), dropped in 2012 but by 2013 was back up to 31%. Demand remained relatively static, if anything we should be seeing a slight drop in CO2 emissions in line with the slight reduction in peak demand.


So with the extra wind capacity in the system and good wind speeds in 2013, we should have seen a drop in the average CO2 for the year when compared to 2011. Instead, we are back where we began in 2011. This would tend to indicate, as Colm McCarthy and ESB have recently stated, that we have reached saturation point with wind energy :


We can see that there was a slight increase in CO2 emissions in 2012, which could be attributed to the drop in the capacity factor of wind but more likely due to a change in fuel mix [see note below]. But for 2011 and 2013, CO2 intensity levels at every range - peak, low and average are almost identical despite the additional energy from wind.

These CO2 figures are also a good indication of fossil fuel used in electricity generation. So are the figures for fossil fuel savings claimed by the Irish authorities real or illusory ? Do they only exist in computer models ? The problem, as explained in an earlier blog, is that an additional MW of wind added to the system, does not always result in the replacement of a MW from conventional sources. The more wind that is added to the system, the more inefficient the use of fossil fuel generators. Running them inefficiently results in more fossil fuel use, and hence more CO2 emissions. In 2013, this problem resulted in the offset of the benefits from the additional "clean" wind energy let into the system. 

This means that if the plans for the doubling of wind capacity go ahead, we could actually see the reversal in the downward trend of CO2 emissions in the coming years.