Showing posts with label energy bubble. Show all posts

Monday, 4 May 2020

Fuel Consumption 2012 to 2018 - the Good, the Bad, and the Ugly


In the course of the transition we will gradually reduce our dependence on the fossil fuels – coal, peat, oil and gas – that currently dominate our energy mix - Alex White, Energy Minister, White Paper, 2015


Despite massive efforts to reduce carbon emissions and fossil fuel dependence by successive Irish governments, the efforts have largely proven a failure, as fossil fuel consumption rose by 15% between 2012 and 2018. The government placed an overemphasis on wind energy as the solution, which doubled in capacity during that time to 3,600MW. Demand may also have increased, which in of itself is a failure to reduce consumption habits, and an over emphasis on the generating of electricity. Demand could have been tackled through retrofitting, promotion campaigns aimed at reducing consumption, moving away from the GDP standard, encouraging saving rather than spending (central bank have been doing the opposite), and preventing population growth by curbing immigration.

The main driver of the increase was petroleum products, including natural gas (used in power stations), which has risen by about 20%.


Natural Gas increased by 20%
In 2012, gas generated half of our electricity, as it did again in 2018, but this time with a significantly higher gas consumption. When your car comes off the motorway and goes into ‘stop start’ urban driving it burns more fuel, just like power plants forced into such operation, as intermittent wind energy pours on and off the grid.   


In their favor, coal and peat decreased by 23% and 8% respectively. The reduction in these, contrary to the common held belief, was due to several factors  - an increase in gas, oil, renewables and electricity imports from the UK (the East West Interconnector began operation in late 2012).  The US achieved a 27% reduction in CO2 emissions during the period 2008 to 2017 by simply switching from coal to gas. So too emissions savings in Ireland arise from switching from coal to gas, a lower emitting fuel,  and importing electricity from the UK, where the resulting emissions are counted, and after that, renewables make up the rest of the savings.  


Peat decreased by 8%


For gasoil and diesel we can see that not only has dependence on transport risen, but  oil used in power generation has also, quite remarkably, increased. Much of this increase is due to an oil powered station in Kerry (Tarbert) which ran more in the grid, presumably because of the closures at Moneypoint. There are also more demand side units, which comprise of diesel generators.


We can also see that we are more addicted to air travel than ever, as jet kerosene consumption doubles. How could a virus pandemic ever be prevented from reaching our shores ?

So we have to ask the question, why are we still consuming high amounts of fossil fuels, after installing so many wind turbines ?  Media reports that show that a high percentage of our electricity came from wind fail to mention what we actually saved as a result. If I cycle from Dublin to Galway, but a car follows me all the way, what have I actually saved ? It is obvious now that they are not a long term solution to reducing dependence on fossil fuels. 

In 2020, there is still, regrettably, peat being used in electricity production, although there is an issue about the impact on employment in the midlands region that has still not being resolved. The renewables industry, as we now know, is not a big employer. 

The Energy Bubble


Generating Capacity for the Republic of Ireland, we have over twice as much as we need

The above graph shows how an energy bubble has been created in the past decade. Whereas in 2006, at the height of the building boom, we only needed enough generating capacity to cover 1.3 times the peak demand, we now have 2.4 times the capacity required. Peak demand levels in 2019 are the same as 2006 levels. All this capacity has to be paid for either through the market or from subsidies that are added on to energy bills. New fossil fuel plant are also in the pipeline.

The Cost 


The EU publishes an energy price report every two years. The last year available of full data is 2016; which shows a circa €490 billion bill for energy sources, €212 billion being imported fossil fuels, plus an additional tax squeeze of €280 billion, of which €76 billion in subsidies is for the renewable sector equating to €208 million per day or €150 from each citizen.

€48 billion was paid directly to wind and solar generators on top of the market price for generating 13% of EU’s electricity mix. 

The market price plus tax paid to gas and solid fuel generators, for generating 41% of the EU's electricity mix, were also €48 billion. 

Turkeys would not vote for Christmas if they were able to educate themselves.


Monday, 26 March 2018

The Energy Bubble is Clearly Unsustainable

by Owen Martin


The Energy Regulator has reported that there is currently a backlog of 36,000MW of renewable and conventional generation connection applications (See above graph). This would increase the current capacity of 10,500MW to a staggering 46,500MW if all of these applications were accepted. As the regulator points out we only have an electricity demand for about 7,000MW. 


Under normal circumstances, only capacity that replaced existing capacity or was required to meet additional demand or reserve requirements would be accepted. Now, because of the rush to meet EU targets, thousands of megawatts of inefficient and intermittent renewable generation are being added. Renewable generation, mostly wind and solar, make up about 70% of the planned generation figure. 


This will lead to a low capacity factor across the board, with all generators operating inefficiently and intermittently. As this blog reported recently, many wind farm companies are making losses. As more generation is added, the market share for all generators will be eroded and we will see more loss making generators. Which will require yet more government intervention to keep the lights on (and possibly another NAMA to be set up).


And it gets worse. The Grid will require a large upgrade as most of these solar and wind farms will be in remote and dispersed regions far away from centres of demand. The costs will simply keep rising exponentially. 

In particular, the CRU notes that the existing backlog of connection applications amounting to 36,000MW is already significantly in excess of the all-island total electricity requirement. Keeping the non-GPA process open to further applications during the consultation period would only increase this volume. This would potentially add to consumer costs with no discernible benefit. 

 For example, with this much renewable generation, it will become increasingly difficult to stabilize and manage the grid frequency. That is why more conventional generation is required to maintain stability and of course this adds to the costs. The Regulator refers to these generators as DS3 providers and has proposed giving them priority over renewable generation :
DS3 system services are required by the system in order to accommodate increasing volumes of non-synchronous renewable generation. The CRU decided in CER/16/284 that providers of those services will be prioritised for a connection offer under the non-GPA process, and requested the system operators to develop a process for this prioritisation. 

The regulator also plans on suspending some of the renewable generation which would of course be a wise decision and be in the interests of all consumers.  Naturally, the renewable lobby groups are not happy and have somehow managed to spin this as a decision that will "result in higher electricity prices." It's difficult to understand why they are lobbying for more supply in an already over-saturated market which will erode the market share of existing renewable generators. 

The energy regulator should stick to the facts and figures as presented in her document. That way she can defend her actions later. It could be the first time an energy regulator has stood up to the green lobby and protected consumer's rights. The Energy Bubble is clearly unsustainable. I for one am hoping that for the first time in recent Irish history, an Irish regulator does the right thing before it's too late.

Sunday, 4 February 2018

Power Stations to Close

New Single Electricity Market rules now in force will see capacity payments cut by 30%.  In some cases, the power stations may not receive any capacity payment at all.

The inevitable consequence of this is the closure of older power stations and less dispatchable plant available to keep the lights on. Dispatchable plant is plant that can be switched on quickly when required. Renewables like Wind energy are not dispatchable because their output is uncontrollable. Ireland (All Island) currently has about 10,000MW of dispatchable plant and about 4,000MW of wind energy. About 1,000MW of capacity will not qualify for capacity payments. This leaves around 9,000MW of dispatchable plant remaining.


Dispatchable plant MW
Remaining dispatchable9,046
Max demand (2010)6,878
Capacity margin2,168
Minimum new data centres1,136
Capacity margin after data centres1,032
Reserve Generation500
Capacity Margin Net Surplus532


When everything is accounted for, including periods of high demand such as occurred in winter 2010 and planned data centres, there is a capacity margin of 1,032MW. Reserve generation is required incase a power station trips out. Currently this is about 500MW. This leaves a net capacity margin of 532MW.

This is quite tight but what happens if Viridian shut down not one but both of their gas power stations in Dublin (they have notified the Regulator that they will close both).  

This would leave a capacity margin of just 132MW. It would be lunacy to allow this to happen as blackouts would be inevitable in a harsh winter.  Dublin would be at most risk where there is a requirement for two large power stations to be on load at all times (three if the UK interconnector is out). 

While it would reduce costs, a blackout would come at a greater cost. 

And what of Northern Ireland ?  Where is the surplus power to come from to export to the North through the North South Interconnector ? The new auction will result in the closure of power stations in the North (Kilroot and part of Ballylumford). Northern Ireland is already at risk of power shortages.

But don't worry the Energy Regulator knows what they are doing I hear you thinking ? Well, I will just leave this here :

http://www.rte.ie/radio1/today-with-sean-o-rourke/podcasts/ 

Look for Tuesday 30th January "Electricity Supply".

The interviewer asks the Regulator how much power do the Viridian power stations supply in percentage terms ? It's worrying that the Regulator had not checked this very important statistic. She replies that they are 800MW capacity so out of 9,000MW, it would be a bit less than 10%. But the 9,000MW is not demand, it's total capacity (capacity must be higher than demand). She also never mentioned the little problem of a minimum requirement for power stations in Dublin. Again, something I thought she should know. 


1) SEMO Auction Results - http://www.sem-o.com/ISEM/General/Capacity%20Market%20-%20Final%20Capacity%20Auction%20Results%20Report.pdf

2) Eirgrid Constraints in Dublin Region -  http://www.eirgridgroup.com/site-files/library/EirGrid/Operational-Constraints-Update-January-2018.pdf

3) Planned Data Centres - http://www.iwea.com/industryreports

4) Maximum demand all time - http://smartgriddashboard.eirgrid.com/#all/demand

Tuesday, 9 August 2016

Rise in PSO Levy Angers Irish Industry


It appears that reality is beginning to bite at The Irish Times in view of the many large industries (some of the biggest employers in the country) complaining about the rise in PSO Levy to fund more wind farms. 

Full Article Here.


In a submission to the CER before it arrived at its final decision, tech giant Microsoft, which employs 1,200 people in the Republic, said this penalises large energy users who are holding energy capacity in reserve to meet anticipated growth.
The multinational also points out that the rate at which the PSO has increased over the last five years represents a “rate shock” for large energy users and “puts the Ireland energy market at a disadvantage”. In a similar vein, Irish food and ingredients giant, Kerry, which employs 4,000 people here, warns that the charge will damage its competitiveness.
Irish Energy Blog has been warning about this for years now, but the warnings have fallen on deaf ears. The Irish Times have been calling for more renewable energy for a long time now and have allowed the wind industry to spread their propaganda far and wide. To be fair, they were not the only ones. 

The only journalist that is going to come out well of this is Colm McCarthy. Of course, there will be no accountability for what will happen in the next few years. An exodus of large companies coupled with a hit from any prolonged Brexit negotiations will see us well back in recession and rising unemployment once again. At a time of record low oil and gas prices.


Will we ever learn....


Sunday, 27 September 2015

Significant amounts of Generation in the pipeline

Eirgrid have announced that they are upgrading their transmission network to facilitate future increases in power generation.  Total planned generation will be 15,000MW by 2023 - three times that of peak winter demand. In otherwords, this is generation that is simply not required.


There is no mention of the cost or environmental impact of all this infrastructure. There is mention that in a period of volatile energy costs renewable energy sources can also contribute to cost competitiveness by reducing dependence on imported fossil fuels but as Irish Energy Blog has shown fossil fuel prices can come down in real life with investment in subsidized renewables preventing these savings from been passed on to the consumer :


Gas Prices Hit Six Year Low but still Electricity Bills rise


There is also the question of whether An Bord Pleanala (or the local planning authority) should carry out a cumulative assessment of this entire project, which includes new transmission and new generation, as it certainly looks like there will be significant environmental impacts.

Wednesday, 26 August 2015

Wind companies holding no assets

Interesting article from BishopHill website today: 


A few weeks ago, and unnoticed by yours truly, David Davis MP took a step to address one of the most egregious practices of windfarm operators.
The big companies that build windfarms tend to put each of their developments in a separate shell company, with a small share capital and funding provided instead through a large loan from the parent company. With profits immediately passed up to the parent, the operating businesses will usually have no net assets, which means that if any large liabilities arise there is nothing available to meet them.
And liabilities certainly do arise. The most obvious ones are claims for damages from the neighbours, whose sleep patterns are disturbed by the noise and the flickering light. Further down the line of course there is the cost of removing redundant windfarms from the landscape. As it is, these costs will fall on the public.
Davis's Public Nuisance from Wind Farms (Mandatory Liability Cover) Bill would force windfarm operators to hold cash and insurance sufficient to cover against these costs. Its second reading is in September.
I don't think the subsidy junkies are going to like it.

The same thing is happening here in Ireland.

It sounds like the Irish taxpayer is being set up once again to pick up the tab for greedy profiteers. 

Monday, 29 June 2015

The economics of electricity generation


The general definition of economic sustainability is the ability of an economy to support a defined level of economic production indefinitely - Thwink.org 
Able to be maintained at a certain rate or level  e.g. "sustainable economic growth" - Definition of Sustainability, Oxford English Dictionary


Traditionally, when you wanted to build a new gas plant, you obtained a bank loan on the basis that the output and hence income of the plant could be determined in advance and was at a price linked to the wholesale cost of gas. There would be a certain amount of downtime for maintenance but your plant would be running for most of the year. This meant that the bank was satisfied that you could meet your repayments.

Total generation capacity in the country was linked to demand for electricity in the economy with some spare capacity for reserve. This meant that the cost of your electricity bill was pretty much directly linked to the amount of electricity you consumed with a few added extras to keep the system running and of course, profitable.

During the last decade, with the advent of intermittent renewables, most notably wind generation, both of the above sound economic principles began to be unwound.

Wind generation requires a subsidy because the output of wind is uncertain and therefore banks would be wary of funding such intermittent generation. The wind might blow, then again it might not. If your 20MW wind farm is only generating at half output i.e. 10MW, the subsidy you receive in effect brings your output up to 16MW (10MW multiplied by € 80 / €50 ). In otherwards you would only have received 10MW * €50 = € 500 MWh but instead you will receive 10MW * 80 =
€ 800MWh. Now the bank will be much happier.

If we now go back to our gas plant that has received bank funding, its output is starting to become more uncertain as intermittent wind is pushed onto the grid. Therefore, its income which was once fairly regular becomes staggered and less certain. Now, the banks will become worried, how certain are the loan repayments ?

So once we introduce alot of intermittent generation such as wind and solar into the system, all forms of generation, which were once dispatchable and reliable, become intermittent. This means that some form of subsidy needs to be introduced for the gas plant either in the form of a REFIT style subsidy on the market price or a capacity payment to ensure the plant remains financially viable throughout periods of high wind and solar penetration. So now, we enter into a new era of electricity generation economics where subsidies are required to maintain all generators, not just the renewables. We reach a stage where the gap between supply and demand is so large that there is simply not enough peanuts to go around for everybody and so subsidies are required for all. This differs from the heavily subsidized farming industry because demand for farming products is always equal to or above supply.

This situation that we then have is the exact opposite of the free competitive electricity market we were promised by the Fianna Fail government, when in 2006 they broke up ESB's monopoly on the market and set up Eirgrid to run the national grid. The fact is that when ESB controlled the electricity market, electricity was much cheaper (and no, I don't work for them).

The housing bubble evolved in exactly the same manner - there was a huge over-supply of houses, developers required subsidies in the form of tax reliefs and cheap credit (we now know that all that cheap credit was in effect a taxpayer funded government subsidy) and there simply was not and never could have been enough demand to maintain that level of supply indefinitely.

So the question is how long will it take for the levels of over investment in the electricity market to begin to become unsustainable and the bubble bursts ? It will most likely happen when the level of electricity bills becomes so high that more and more consumers fail to pay the bills on time or at all. Disconnections will rise. Quite a large proportion of the hikes in energy bills are loaded on industry. When most of them decide to jump ship to more competitive countries, as in the case of Cadburys, we are deep trouble, not just because of the resultant job losses, but because there will be a significant hole in the funding of the electricity bubble. When holes begin to develop at the bottom of a pyramid, the whole pyramid eventually collapses.

When this happens, subsidies to generators will be slashed, loan repayments will no longer be met, and the banks will be facing another hole in their balance sheets. In effect, this means that today, the electricity generation assets on the balance sheets of banks are significantly overvalued. Their current valuation is only as good as the ability of the electricity consumer to continue funding indefinitely the ever wider gap between electricity supply and demand (and the supporting grid infrastructure required to support it).

It may turn out that because electricity is a necessity good, the bubble will continue for longer than the housing bubble. This then means that people will have less discretionary spending in direct proportion to the increasingly higher electricity bills. So there will be a period where the electricity bubble will impact other sectors in the economy, themselves already impacted by the higher bills (e.g. a designer clothes shop will be impacted twofold with less customers and higher bills).

There are alot of industries dependent on discretionary spending in Ireland and along with the water charges (water is another necessity good), the hikes in energy bills will put a squeeze on them. Cold weather will also increase the demand for coal and oil - necessity goods which are now heavily taxed. With government policy, and the majority of investment, focused almost solely on electricity generation and windmills, people have little choice when it comes to heating their homes e.g. the investments into retrofitting and energy efficiency are tiny compared to wind energy.

In this scenario, different sectors in the economy will start to feel the squeeze and we will see another recession. This will be the beginning of the bottom sections of the pyramid collapsing. On top of this will be the disappearance of large industry - another section at the bottom of the pyramid gone. The electricity bubble will have collapsed but, like the housing bubble, will have brought down alot of other industries with it.

But whatever the sequence of events - one thing economists know for certain is that an economic bubble will eventually collapse.


Tuesday, 7 April 2015

Five Reasons why we have reached saturation point with wind energy

To any impartial analyst, Ireland has reached saturation point with wind energy and it should now be time to put a pause on new wind development and consider our options. No damage was ever done down through history by pausing before deciding what to do next. Think of how many billions of euros we could have saved if this was done in 2006.

  1. Dumping of wind power and the 50% limit on wind - recent evidence shows that during periods of high winds we have to dump more and more of available wind energy to maintain a safe secure supply of electricity.  On the 30th March, at least 26% of available wind energy was dumped. 
  2. Over capacity - We now have generation capacity equivalent to double our peak demand and three times that of our average electricity demand needs. Let's use up this excess capacity before we start building any more. No new generating units (including wind) need to be built unless they are replacing retired units.
  3. Baseload plant minimum load requirements - there is a requirement for 5 large generating units to be running at all times for "dynamic stability". These comprise combined cycle gas turbine plants and Moneypoint coal plant. This means they can never be completely switched off. Increasing wind penetration further will exacerbate the inefficiencies inherent in running these plant on low loads, thereby negating any additional savings due to adding more wind.
  4. Electricity bills are one of the highest in Europe - government policy has locked society into high electricity prices with the preference towards subsidized forms of generation meaning savings from falls in wholesale prices can never filter down to consumer's bills. Another factor is that an over supply of generation capacity results in units requiring subsidies and capacity payments to recover their high fixed costs as payments for energy generation become insufficient and staggered due to low demand and more intermittent wind on the system. There are also extra costs due to new infrastructure required to carry the wind power.
  5. Impacts on other sectors - The tourism and equine industries are two of the largest industries in Ireland supporting many direct and indirect jobs. Chances are if you live outside any of the main cities, your job is dependent in someway on either of these industries.  Planting wind farms and associated pylons near scenic and horse breeding locations will have a negative impact on these important industries.  The Irish Hotels Federation recently warned that the location of energy infrastructure should not diminish the natural beauty of the landscape because this is an important element of the Irish tourism product. Already, this impact is being felt with one castle owner recently saying "The tourists can't believe it. They said we're mad. They said we're ruining our heritage. They say it's disgusting to go around Ireland now"

Tuesday, 17 March 2015

Response to Irish Times article by Joseph Curtin

One and one equals two, six less four equals two, four by three equals twelve - can you do the maths ?


"To think that two and two are four, and neither five nor three, the heart of man hath long been sore, and long tis like to be" - A.E. Housman

Critics of Ireland's current energy policy have now been told by Mr Curtin of the Institute of International and European Affairs in Dublin that they can't count in an Irish Times article  :

Critics of Irish wind energy have got their sums wrong - Irish Times


So lets see who has the deficiency in mathematics.

The reason is not wind but rather the cost of importing gas. 
The problem is that more than half of Ireland’s electricity is generated from gas – the fourth highest share in the EU – leaving us more exposed than other countries to gas price increases. When gas prices increase, electricity prices here increase more, and Ireland’s competitiveness declines.
Wind replaces more expensive generation options, reducing their operational and fuel costs. The final net impact on consumer bills is minimal. 

 The Academy of Engineering point out the fuel price differentials in their July 2014 report :

 SEAI’s recently published analysis of the” Benefits of RenewableElectricity in 2012”  indicates that in the Republic of Ireland the 4.09 TWh of wind generation is estimated to have saved €177 million in fossil fuel imports i.e. €43.2 per MWh and reduced CO2 emissions by 0.37 tonnes per MWh - indicating that wind almost exclusively displaced highly efficient gas-fired CCGT generation. Wind generators received in excess of €80 per MWh for wind output in 2012. This means that wind generation added almost €40 per MWh to the electricity sector cost base in 2013 i.e. €165 million. This does not include the impact of wind-related transmission cost increases or system operation cost increases.  
So if faced with a choice of paying € 43 MWh or € 80 MWh , which would you prefer to pay ? I don't know about you but personally I would like to pay € 43 MWh. So if we stopped all fuel imports and powered our electricity completely by wind (which is impossible), we would have to pay almost € 40 per MWh extra in our bills. This is because gas does not receive a subsidy while wind does.


Simple Maths Sum # 1

Cost of gas  ---   € 43 per MWh

Cost of wind --- € 80 per MWh

Difference  ---  € 37 per MWh --- which is the additional amount we must pay when wind displaces gas


The reason is not wind but rather the cost of importing gas. Between the summers of 2009 and 2013 wholesale gas prices almost doubled across the EU. Analysis by the International Gas Union shows that between 2007 and 2013 prices increased consistently in all regions except North America.

2009 was the last time a crash occurred in oil and gas prices. So obviously prices increased after that.


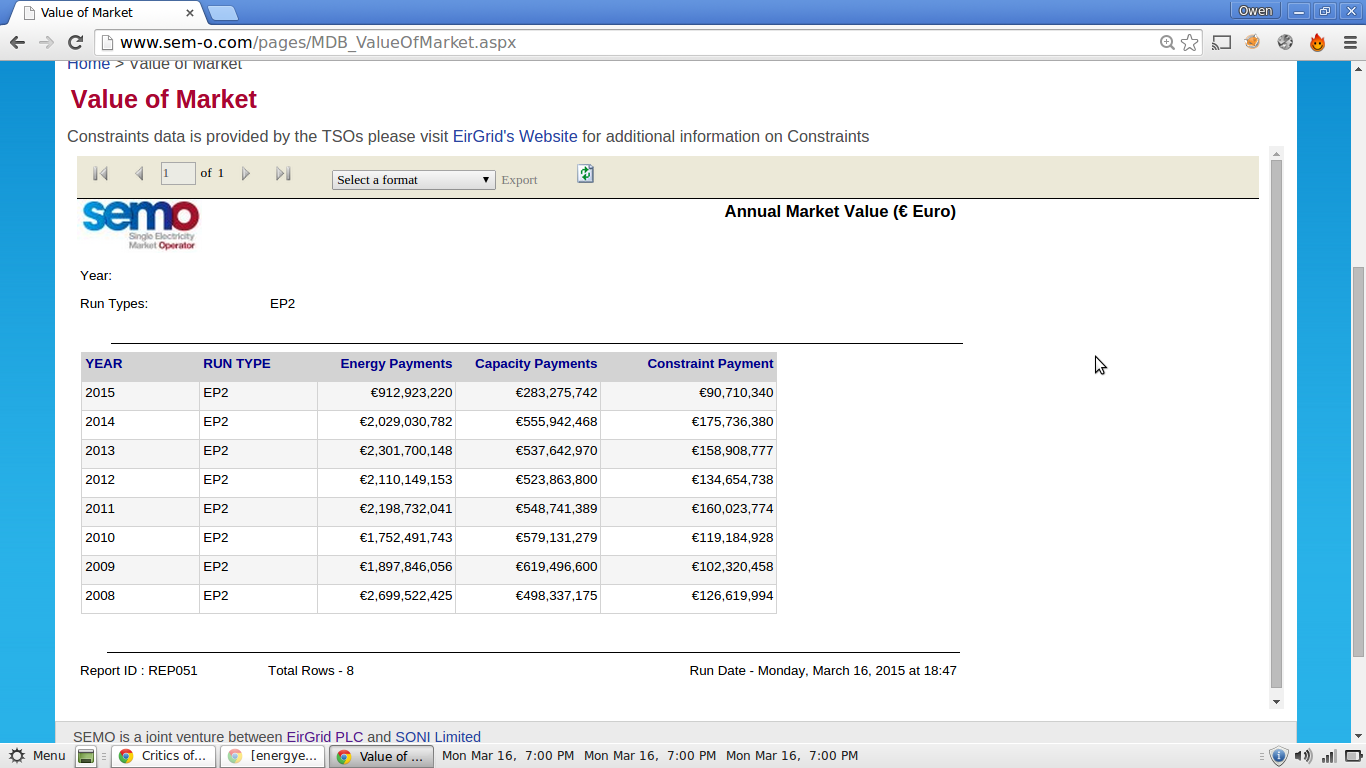
So gas (and oil) prices hit a peak in 2008. There then was a dip in 2009 and a slight rise after that. This is reflected in the Annual Energy Payments (The market price per MW sold per half hour) below provided by SEMO :


As you can see Energy Payments, which are a direct reflection of wholesale prices, hit a peak in 2008 of € 2.7 billion and have not come anywhere close since. So our electricity bills should have come down since then by Mr Curtin's logic. But instead our bills have gone back up again and now exceed 2008 prices :


So Energy Payments (which gas prices determine) fell by about half of a billion euros between 2008 and 2011 but our electricity prices continued to rise in this period. So can you do the maths ? What else could be pushing up our bills ?

Lets look at the electricity bills in 2014. Have they come down yet ? Do you know how numeracy works - € 24.05 (2014) is greater than € 20.33 (2008) i.e. electricity was more expensive in 2014 than 2008 , but Energy Payments were higher in 2008 (€2.7bn) compared to 2014 (€ 2bn) (click on each table to zoom in) so the bills should have come down by Mr Curtin's calculations.

From SEAI


From SEAI
So what else could be pushing up our bills ?

Well, the answer is we are in the middle of an energy bubble that is really indefensible :

http://irishenergyblog.blogspot.ie/2015/01/energy-bub.html


All this additional capacity must be financed through electricity bills, whether that capacity is used or not. Excess capacity is financed through capacity payments and the PSO Levy. Most of this excess capacity is due to the € 4 billion investment in wind generation - it's not an anti-wind position to state this, it's simply a statement of fact.


Another factor is Ireland’s lower population density. We need about 70 per cent more metres of cables per person than the average, which feeds into higher prices.


This was always the case in Ireland. As can be seen from the below graph, it didn't prevent Ireland from having a very competitive electricity price during the 90s before they started this renewable gig :


In 2015 electricity prices will decline further, driven again by lower forward gas prices. The correlation is as clear as day.
Has anyone seen these lower electricity prices ? Last time I checked my bill the PSO Levy was going up once again. Can anyone find one of these bills with lower prices ? Please do let me know.

The situation is exacerbated by the fact that Ireland must import its gas from the UK through interconnectors, and Irish consumers bear this additional cost.
Funny then that we once had lower electricity prices that the UK during the 90s when we still were reliant on UK fuel imports :


Others have identified “hidden” network costs they argue are necessary to facilitate wind. It is true that Ireland is currently modernising an electricity network that for many years suffered from chronic underinvestment. Current investments also support traditional generation, increased demand in the regions, and indeed a more responsive, intelligent and modern grid generally.
It is now accepted by almost everyone that Grid 25 is required to facilitate renewables, including Eirgrid :

The implementation of GRID25 is essential if Ireland is going to meet its targets for generating electricity from renewable sources (link). 

Next we are told:
Current investments also support increased demand in the regions
There is no expectation for "increased demand in the regions". In fact, there are gas plants lying idle in the Western Region for example, Tynagh which ran for the equivalent of 2 months in 2013 (link here) and Rhode oil plant in the midlands which ran for a total of 17 hrs in 2013 - "A further trend of decrease for the stations total running hours is predicted for the coming years. This is attributable to a lower demand from the National Grid" (link here). 


Current investments also support traditional generation

Current investments in the grid have nothing whatsoever got to do with traditional generation. This shows a very poor misunderstanding of how power generation and grid infrastructure works. Traditionally, power stations were placed close to towns and areas of large population. The grid infrastructure was larger at the power stations and towns and then progressively smaller as it reached remote regions. With the advent of wind generation, grid infrastructure now has to be built inversely i.e. larger cables in remote locations are required to bring the energy to the towns and cities.


There are also other hidden costs which are directly attributable to wind such as constraints payments for conventional plant which I have written about here :

http://irishenergyblog.blogspot.ie/2014/12/whats-in-electricity-bill-part-2.html

You can see that they have risen every year since 2010 as wind penetrations got higher and the smooth running of plant got ever more interrupted. The Energy Regulator accepts that "More and more wind on the system adds extra costs."


Total investment in wind will reach €3.5 billion by 2020. This is a frightening number, leading several commentators to make the simplistic assumption that consumers will have to foot this bill.
Simple Maths Sum # 2

4,094MW onshore @ € 2 million per MW = € 8.1 billion

555MW offshore @ € 3 million per MW = € 1.6 billion

Total investment = € 9.7 billion not € 3.5 billion

External Sources for these figures can be found on this blog 
http://irishenergyblog.blogspot.ie/2015/02/20-billion-committed-under-irelands.html
and this one
http://irishenergyblog.blogspot.ie/2015/02/cost-of-renewables-infrastructure-in.html

Since we are engaging in simplistic argument, it is not the Irish consumer but the king of Norway who will pay. We import the largest proportion of our gas from Norway, and investment in wind will reduce coal and gas imports by nearly €300 million per annum by 2020. Consumers will benefit by not having to pay for these imports.
Why deal with simplistic arguments when one can actually look at the detail ? Could it be that simplistic argument is the coinage for a propaganda machine ? Dr Fred Udo has done an analysis using SEAI and Eirgrid data and found that running our CCGT in an efficient way would save more fuel than the investment in wind did.

http://irishenergyblog.blogspot.ie/2015/03/wind-turbine-build-outs-and-co2.html

That's right, using modern CCGT in an efficient way saves fuel - thats the rationale behind using fuel efficient generators whether its the engine in your car or the generator in a power plant. The King of Norway in no way feels threatened by 13th century technology. In fact, wind power is very reliant on gas for its own house load needs.

The deployment of wind creates economic growth in Ireland and investing in Irish wind instead of Norwegian gas boosts activity in the local economy. Analysis suggests that GDP would be boosted by €500 million per annum by 2020, creating thousands of jobs in the process.

Airtricity operate 25% of Irish wind farms - owned by SSE, a British company

Energia operate 25% of Irish wind farms - owned by Veridian plc, a British company which is ultimately owned by Arcapita Bank based in Georgia, USA.

Bord Gais operate 15% of Irish wind farms - owned by Centrica plc, a British company. It was rumoured in July last year that Qatar were attempting to buy a large stake in the company.


____________________________________________________________________


Thursday, 29 January 2015

More on the Energy Bubble


Figure 1: How generating capacity has increased since 2006. East West Interconnector included in 2013 and 2014, also Great Island CCGT included in 2014 and retired oil plant on same site taken out


The above graph, Figure 1, shows the levels of electricity generation capacity for the Republic of Ireland at the end of 2014. We are now approaching the 10 GW mark, the highest ever in the State. If you really want to know why your electricity bills are so high then you only need to look no further than the above graph. All the above power stations and wind farms have to be financed through our bills, even though we only use on average less than a third, and at peak times less than half, of this capacity in electricity. The key to understanding this graph is looking at the gap between the blue (average demand) and black line (total capacity including wind) and the red (peak demand) and black line in 2006 and then comparing this gap with the current gap in 2014 (See Figure 2). As you can see, it has gone out of control. Consider that back in 2006, when the economy was booming, there were no blackouts . The level of back up capacity was sufficient but now that we have over 2GW of wind, it appears that more back up capacity is required to maintain a stable and reliable system.


2006
2014
Total Capacity
/ Average Demand
2.0 times
3.2 times
Total Capacity
/ Peak Demand
1.3 times
2.0 times
Figure 2: Total Capacity is now over 3 times that of average demand and double that of peak demand

There is an argument put forward by the Greens that this excess capacity will be required when everyone switches over to electric cars and electric heating systems as this will lead to a surge in average and peak demand. But there is a major flaw in this argument. You would still need enough dispatchable plant (i.e. plant that can be switched on and off at the touch of a button rather than when the wind blows) at least equal to the peak demand under this scenario, no matter how many wind farms there are. Otherwise, what would everyone do on a calm day like the 11th October 2014 ? Cycle the 10 or 20 miles or more to work ? Or perhaps wear extra woolly jumpers ? So you would still need to build more power stations to cover the surge in demand under this scenario and wind turbines would still result in excess capacity just like in the above graph.

Fuel Mix 2013 - another historic milestone


Figure 3: Fuel Mix 2013 with UK imports broken down into original fuel sources

Figure 3 shows that in 2013, Ireland used nuclear power for the first time. 2% of the electrons going into your electric socket in 2013 came from nuclear stations in the UK. I have broken down the power consumed here through UK imports into their energy sources and added that to the fuel mix provided by SEAI to arrive at the above chart. UK coal power accounted for 40% of our imports with gas at 25% and nuclear at 21%. The 10GW or so of UK wind provided just 6% of imports. So we are still very reliant on gas and coal power - almost 70% of the electrons entering your home in 2013 came from gas and coal power. (not including spinning reserves or back up generation)

But when we look at SEAI's original chart it tells an interesting story :

Figure 4: SEAI Fuel Mix 2013


While on the face of it, wind power did well, one has to put the output of a generator in the context of its generating capacity. The following table (Figure 5) shows the share of generating capacity each energy source had in 2013, so for example, gas plants made up 44% of the entire power plant and wind farm fleet in 2013.


Ireland's Power Generation Mix
2013
Gas
44%
Wind
20%
Coal
9.5%
Peat
4%
Interconnection
5.5%
Oil
12%
Hydro
2%
Pumped
3%
Figure 5: Generating mix 2013

Definitions used :

Grid Acceptance Rate (GAR): the rate at which when power becomes available from a generating source that it is accepted by the grid. So wind power has a grid acceptance rate of 1:1 because it has priority dispatch, meaning when wind power is available it is automatically taken by the grid. Gas has a GAR of between 1:0.8 - 0.9 because when wind becomes available it pushes gas off the grid. I will assume 1:0.85 for this analysis. Coal and Peat are assumed to have a GAR of 1:0.95 as they are occasionally pushed off by wind

Fuel / Capacity Ratio : the position of a fuel source in the fuel mix relative to its position in the generating capacity mix. So a fuel source that makes up 50% of the capacity and 50% of the fuel mix will have a fuel / capacity ratio of 1:1.

Gas power gave just over 1MW power for 1MW share of capacity so had a fuel / capacity ratio of 1:1. Peat gave over twice as much power as capacity (2:1) while coal gave approx 1.6MW power for 1MW capacity (1.6:1). It is no surprise that the highest emitting power sources produced the most power relative to their size. This is because coal and peat store higher concentrations of energy than other fuel sources having formed over millions of years. Oil power, representing 12% of capacity, had a negative fuel / capacity ratio because these plants were lying idle most of the time. Oil plant are mostly used for "peaking" , i.e. when peak demand goes above normal which doesn't happen very often nowadays. So it had a significantly low Grid Acceptance Rate (somewhere around 1:0.01), whereas gas, peat and coal had GARs very close to 1:1 (between 1:0.85-0.95)


So how did wind do? Well, it had a negative output relative to its share of capacity. It comes out at 0.8MW of power for each share of MW installed. This is despite it having priority dispatch i.e. when the wind blows, the power is taken straight away by the grid. So levels of other power sources - mostly gas, and sometimes coal and peat - are reduced when wind is available. Applying the above definitions, this means that wind had the best Grid Acceptance Rate of all fuel sources i.e 1:1, but had a negative fuel / capacity ratio of 0.8:1. So wind and oil came out the worst, but oil had the lowest Grid Acceptance Rate, whereas wind had the highest. What this shows is that wind is a poor storage of energy when compared to coal, gas, peat and oil and storage solutions cannot solve this problem, rather it simply transfers the storage of this energy from one hour to another. What is required is a renewable source that contains higher concentrations of energy


And herein lies the problem with wind energy - you can't run a reliable grid if you install power plants that almost always give a negative fuel / capacity ratio. If you install 1,000 MW of wind, and demand hits 1,000MW, the power from the wind will almost always be less than 1,000MW so you have a blackout. This problem means that wind energy can never replace conventional plant and so competitiveness goes out the window