Sunday 31 May 2015

Eirgrid forecast higher demand than during the boom


In Eirgrid's recent capacity statement, given a recovery scenario, demand for electricity by 2019 is forecast to equal demand at the height of the boom and after this it is forecast to exceed these levels.


Ireland, like the UK, has a low energy to GDP ratio. We barely manufacture anything here, most of it is outsourced to China and India, so what exactly are Eirgrid expecting ? Perhaps there will be another industrial revolution, this time in Ireland.

It appears that Eirgrid are basing these high forecasts on data centres such as Apple moving to Ireland:
After some years of decline, demand in Ireland has shown some signs of increase. In the near future, more growth is expected to come from the expanding data centre sector which already accounts for over 200 MW of demand, and which is incorporated in our demand forecasts

 This means that data centres are highly energy intensive, consuming power equivalent to half the output of a conventional gas power plant on full load (Gas plants are usually 400MW). If this is the case, then erratic wind energy can in no way ever provide sufficient reliable power to a data centre. Some form of conventional back up power supply will always be required.

So why are these data companies always held up as a shining example by the green movement ?

But in any event, I will put my blogger reputation on the line, and predict that these demand levels will not materialize. The rising cost of electricity for industry will surely drive any heavy industry out that might consider re-locating here.

Saturday 23 May 2015

Emissions rise during March with increased use of oil generation as back up


Admin Note - There are a lot of diagrams in this blogpost once again but I believe they tell an interesting story so please bear with me. Apologies if you experience formatting problems - these are not intentional !


However, it is an unfortunate fact that the contribution to adequacy of additional amounts of wind decreases progressively and tends towards zero [ESB 2004]. 

Diagram 1 - All Ireland average wind penetration levels (Eirgrid)


We can see from the above diagram that average wind penetration for the month of March has nearly doubled since 2012. Let's see what impact this has had on the running of our electricity system. 

Diagram 2: Fuel Mix March 2012 (wind penetration 13%)


Diagram 2 shows the fuel mix for March 2012. Black represents coal, gas is yellow and green is wind. 
Gas is acting as back up to the intermittent wind. Given Ireland's generation capacity, this is the most 
efficient and cleanest form of back up. Hardly any oil generation was used.


Diagram 3 - Fuel Mix March 2013 (wind penetration 17%)

Diagram 3 shows a similar fuel mix as 2012 but with some oil generation (red shading at top)


Diagram 4: Fuel Mix 2014 (wind penetration 21%)

Diagram 4 again shows a similar fuel mix for 2014 but with small amounts of distillate 
(i.e. diesel) oil generation (light green shading at top) and heavy fuel oil (red).

Now we come to March 2015:


Diagram 5: Fuel Mix 2015 (wind penetration 24%)

You probably have noted that gas generation has become comparatively less and less 
each year as wind penetration increases. But what we see now in 2015, with average and 
maximum wind penetrations of 24% and 61% respectively, is significantly more distillate and 
conventional oil generation. This meant that emissions from conventional generators 
increased as "dirtier" inefficient oil replaced "cleaner" more efficient gas generation. 
Why did this happen ? Well, if we take a look at forecast and actual wind generation 
for a period in March 2015 it will give us a clue :


Diagram 6: Wind forecast and generation March 2015

The intermittent nature of wind is evident in Diagram 6. The red line shows forecast wind and 
it is clear that actual wind (blue line) failed to meet forecast wind on numerous occasions 
during this period.

Oil generators have a unique characteristic in that they are very fast acting, in Ireland it 
typically take eight minutes for them to reach full capacity, compared to say a gas generator 
which can take up to eight hours to start. But there is a trade off - oil produces more emissions 
due to its energy dense nature while gas, once the generator is up and running, produces about 
30% less nitrogen oxide and carbon dioxide than oil. Gas plants are also much more efficient 
in terms of fuel consumption. So what has happened is that fast acting oil generators are 
stepping in to meet loss of supply due to unforeseen drops in wind power.

If we take a system with lower levels of wind penetration, like in 2012 / 13, we can see that 
gas generators can cope with these wind levels as sudden loss in supply from wind generators does 
not cause a major problem to the system. But we can see in Diagram 6 losses in wind generation 
of up to 400MW, which is akin to the loss of the largest power plant in Ireland. One might ask, 
but surely, there is reserve there for such a loss of power - well there is, but in my opinion, 
this would be reserved for the loss of a power plant rather than loss of wind power.

The conclusion from this is that the system can cope with wind penetration of circa 20% but as 
you go above this level, the benefits from wind energy diminish, as you have to back it up with 
fast acting higher emitting plant. I have long believed that we have reached saturation 
point with wind energy and this data confirms this. It is clear that an all wind strategy does 
not make sense.

While nuclear should be an option but requires a long term plan of itself, there is a simpler 
solution, that does not require back up oil plants, new pylon infrastructure or a new expensive 
Grid Code to accommodate high levels of unstable wind energy, to meeting our renewable 
targets - biomass. 

The below presentation gives a good summary of the benefits of this option :


While wind provides non dispatchable generation (incapable of been switched on when 
required), biomass provides dispatchable generation (can be switched on as required). 
This means that biomass generation can replace an existing power station (eg Moneypoint 
coal power station) and utilize existing grid structure. 

________________________________________________________________________
Other Data

For completeness sake, the below diagram shows March demand for the years 2012  - 2015. 
You can see that there was a couple of days where peak demand was higher in 2015 
(and also lower) but in general, demand was roughly the same and therefore does not 
account for the increased use of oil generation. 


Wednesday 20 May 2015

Cost Benefit Analysis obligations for Ireland's Renewable Action Plan - Part Four


Abuse of your right to a ‘highly competitive social market economy’


By Pat Swords BE CEng FIChemE CEnv MIEMA


Article 3(3) of the Lisbon Treaty (TEU) made it very clear what the objectives of the European Union were:

  • The Union shall establish an internal market. It shall work for the sustainable development of Europe based on balanced economic growth and price stability, a highly competitive social market economy, aiming at full employment and social progress, and a high level of protection and improvement of the quality of the environment. It shall promote scientific and technological advance.

This direct reference to a ‘social market economy’ is absolutely fundamental. While there is no strict definition of this term, it essentially evolved in post-war Western Germany and is generally defined as:

  • An economic system based on a free market operated in conjunction with state provision for those unable to work, such as elderly or unemployed people.

Principally one can see it, as what differentiated the highly successful Western Germany from the State planned economies on the other side of the Iron Curtain. At its core is your freedom of choice as a consumer, to purchase your products and services where you see fit and achieve the value and quality you desire. Distorting the ‘social market economy’, such as by the provision of State Aid is a serious issue, as there is no longer a level playing field and the rights of the consumer are being infringed. As such then Article 107 of the Lisbon Treaty (TFEU) applies:

1. Save as otherwise provided in the Treaties, any aid granted by a Member State or through State resources in any form whatsoever which distorts or threatens to distort competition by favouring certain undertakings or the production of certain goods shall, in so far as it affects trade between Member States, be incompatible with the internal market.

2. The following shall be compatible with the internal market:

(a) aid having a social character, granted to individual consumers, provided that such aid is granted without discrimination related to the origin of the products concerned;
(b) aid to make good the damage caused by natural disasters or exceptional occurrences;
(c) aid granted to the economy of certain areas of the Federal Republic of Germany affected by the division of Germany, in so far as such aid is required in order to compensate for the economic disadvantages caused by that division. Five years after the entry into force of the Treaty of Lisbon, the Council, acting on a proposal from the Commission, may adopt a decision repealing this point.

3. The following may be considered to be compatible with the internal market:

(a) aid to promote the economic development of areas where the standard of living is abnormally low or where there is serious underemployment, and of the regions referred to in Article 349, in view of their structural, economic and social situation;
(b) aid to promote the execution of an important project of common European interest or to remedy a serious disturbance in the economy of a Member State;
(c) aid to facilitate the development of certain economic activities or of certain economic areas, where such aid does not adversely affect trading conditions to an extent contrary to the common interest;
(d) aid to promote culture and heritage conservation where such aid does not affect trading conditions and competition in the Union to an extent that is contrary to the common interest;
(e) such other categories of aid as may be specified by decision of the Council on a proposal from the Commission.

As has been documented previously, nobody knows what the renewable programme is actually to deliver in terms of quantified carbon savings, while there is a complete lack of knowledge, as to what the environmental damage cost of carbon actually is. So instead everything is based on ‘spin’, such as highlighted previously the wildly inaccurate claims of carbon dioxide savings made in the REFIT I application for State Aid for Environmental Protection.

Even worse in February 2012, when the EU approved under REFIT II, a further 4,000 MW of wind energy representing a capital investment of some €8 billion, they did so on the back of a ‘one pager’ from the Irish authorities. This simply stated that by 2009 14.4% of Ireland’s electricity was from renewable sources and this new State Aid would contribute to achieving the target of 40% of electricity from renewable sources. So nobody has a ‘barney’ as to what the alleged positive environmental protection actually is.

Of course if proper due process was followed, the reality would expose the adverse impacts, both environmental and financial, to completely outweigh any claimed for environmental benefits. Indeed, the Principle of Proportionality, a key aspect in the case law of the European Court of Justice, requires each decision and measure to be based on a fair assessment and balancing of interests, as well as on a reasonable choice of means. Simply put, the extent of the action must be in keeping with the aim pursued.

As a result, State Aid for Environmental Protection, such as priority access to the grid and preferential tariff arrangements, has to be based on proportionality. As the 20% renewable energy Directive 2009/28/EC further clarifies:

  • Rules governing authorisation, certification and licensing are objective, transparent, proportionate, do not discriminate between applicants and take fully into account the particularities of individual renewable energy technologies.

Furthermore, the 2008 EU Commission’s guidelines on State Aid for Environmental Protection are clear in that:

  • Aid is considered to be proportional only if the same result could not be achieved with less aid.

  • In particular, the aid amount must be limited to the minimum needed to achieve the environmental protection sought.

These State Aid rules are specific, there has to be a balancing test completed between positive impacts of the aid and its potentially negative side effects. So how could these procedures have been followed and legal compliance ensured, when we have no data on this alleged environmental protection or ‘comparative costs’ to achieve it? Indeed, as the EU could only write to UNECE during the investigation by the Compliance Committee on Communication ACCC/C/2010/54; “it is generally recognised that renewable energy, and wind energy in particular, is preferable from the environmental point of view to non-renewable energy”. No actual quantified information ever existed, which could be referred to.

However, it is after all only common sense to question the sense of pouring billions into wind generation, which at best results in a cost of about €160 per tonne of carbon emissions savings achieved, when even within the eleven different sources of renewables defined in the 20% renewable energy Directive, there were a multitude of others which could have been used to achieve the same savings at a fraction of the cost and environmental impact. Indeed, the current carbon trading price of less than €5 per tonne clearly demonstrates that there is a huge range of viable carbon reduction projects available, such as in energy efficiency, at a fraction of the cost of wind energy.

However, it is not as if this wasn’t known in advance. In 2004, the engineering report published by Eirgrid, on the impact of wind energy and its intermittency on the economics of operation of conventional plant, highlighted not only the practical limitations, but also the very high cost associated with wind energy, given other far more cost effective alternatives available for carbon abatement. It was completely ignored.

So in conclusion, the fact that the consumer no longer has free choice with regards to the selection of the most cost effective electricity generation available, and instead  has to fund ever more expensive renewables, is solely because a complete abuse of the State Aid procedures for Environmental Protection occurred.

Saturday 16 May 2015

Electricity disconnections now over 600 homes a month


The Irish Independent today report that :


The latest figures from the energy regulator show that 1,852 homes had their electricity cut off - while 633 had the gas disconnected between January and March 2015.


The Commission for Energy Regulation (CER) said in a report that these domestic disconnections cover customers in arrears who cannot pay due to financial hardship as well as customers who choose not to pay.

For electricity customers, this works out at over 600 homes a month.  Pretty shocking considering that wholesale prices for gas and oil have come down to their lowest for six years and we have over 2,000MW of "clean, free" wind energy.

Disconnection rates were highest for those with smart meters which are designed to reduce demand during peak periods by charging higher rates. Which means children have to go without dinner when they come home from school if the parents cant afford to put money in the meter. Has anybody looked at the social consequences of these demand reduction measures ?

Saturday 9 May 2015

Cost Benefit Analysis obligations for Ireland's Renewable Action Plan - Part Three


What is being used to justify the approval of wind farms in my vicinity?


By Pat Swords BE CEng FIChemE CEnv MIEMA


That wind farms have a negative financial and environmental impact is very clear, so what is the actual benefit in terms of alleged climate change impacts. As previously documented, no actual quantifiable data in this regards actually exists. Yet wind farms engage the Directive on Environmental Impact Assessment, in which there is a legal obligation on the competent authority for the planning decision under Article 3 of the Environmental Impact Assessment Directive to complete the following.

  • The environmental impact assessment shall identify, describe and assess in an appropriate manner, in the light of each individual case and in accordance with Articles 4 to 12, the direct and indirect effects of a project on the following factors:

(a) human beings, fauna and flora;

(b) soil, water, air, climate and the landscape;

(c) material assets and the cultural heritage;

(d) the interaction between the factors referred to in points (a), (b) and (c).


In reality this occurs in the planning inspector’s report, if at all. If we consider a number of An Bord Pleanala reports for wind farms, which were granted planning permission, we get the following typical wording:

  • With regard to the operational impact of the proposed development, I would concur with the findings of the EIS that the generation of renewable electricity by the proposed turbines will have a wider positive impact on climatic considerations in terms of reducing carbon emissions thereby contributing to national and international emission reduction objectives through the displacement of traditional methods of energy generation by the unsustainable combustion of fossil fuels such as coal and oil.

  • The generation of electricity from the wind farm will result in an avoidance of greenhouse gas emissions that would otherwise occur from fossil fuel power generating plants.

  • Along with other wind energy developments in the area, the proposal will contribute to national targets for renewable energy generation.

  • The proposed development will contribute to limiting CO2 emissions.

In other words they haven’t a clue. So you can believe in this Green Agenda and welcome it. However, if you question it, you will quickly find that like the financial crises, it is based on nothing but Groupthink, hype and the failure to follow proper regulatory procedures.  

Thursday 7 May 2015

Does wind energy reduce wholesale prices ?


Definitions 

SMP : System Marginal Price from which the wholesale price of electricity is derived
System Load : Electricity Demand for All Ireland system


All sorts of claims are made by all parties on the effects of wind energy on wholesale prices. Let's have a look at two recent days - 2nd and 23rd February - to see what impact, if any, wind energy has on wholesale prices. We can see that the demand for both days is very similar with a slightly higher peak on the 2nd.


Demand Profiles for both days for the Republic of Ireland only (information not available for All Ireland)


Wind generation was very high on the 23rd but very low on the 2nd. So we would expect lower wholesale prices on the 23rd.

Wind generation profiles for both days (Republic only)


On the 2nd, we can see that the average price was around € 50 with a peak price of about € 260 

(Data taken from SEMO market data).


On the 23rd, the average price was also about € 50 with a lower peak price of approx € 210. The higher peak price on the 2nd may well be due to the higher peak demand (load) or lower wind 
on the 2nd or indeed a combination of the two.


But the important thing is that on average, prices for both days were remarkably similar at about €50 per MWh. What has happened in both cases is that the cost of gas generation, rather than wind, has determined the price. The ESRI graph below confirms that the price of gas comes in around the € 50 mark.

Let's take 2 different days - one with wind providing 1,000MW and another with zero wind. Demand is 4,000MW for both days. The marginal cost of generating a MW of gas power at 3,000MW on the windy day is the same as the cost of generating the last MW at 4,000MW on a calm day. So what we
will see is that both days, like in the above case, will have very similar or same market prices.


ESRI
 explain how the wholesale electricity price is determined :

The most expensive plant needed to meet demand sets the marginal price,
which is paid out to all generators producing electricity during that period.
The marginal price essentially reflects the cost of fuel and carbon needed to
generate the last MWh of electricity.
Since wind generation is assumed to have a short-run cost of zero, more
wind tends to put downward pressure on electricity prices, up to a point. Wind
generation is by its own nature variable. When wind dies down thermal plants
(typically fuelled by natural gas or coal) must be available to pick up the slack
in order to maintain a reliable electricity system. It takes several hours for a
thermal plant to warm up to the point where it can generate electricity. To
take this feature into account, we assume that a certain number of thermal
plants must always be on at their minimum stable capacity. The number of
plants that are constrained on depends on the time of the year and the level of
electricity demand and is determined on a monthly basis by the model. When
thermal plants are constrained on and would not otherwise have been dispatched 
by the market, they do not bid their marginal cost into the market;
rather, they are compensated for this generation through constraint payments
which equal their marginal cost, regardless of market prices. At times the
need to constrain on thermal plants to maintain reliability might also cause
the curtailment of available wind generation. Wind curtailment is recognised
by the system operators to be a likely event (EirGrid and SONI, 2010).


The above diagram shows the merit order with which each type of generation is taken.
If gas becomes cheaper than coal, then it will move down the merit order and be chosen before
coal. But at the moment mid-merit gas usually generates the last MWh of electricity. Hence, why
the market price is usually based on the gas price.  We can see from the below Eirgrid document 
that the System Marginal Price (SMP) does indeed follow the Gas Price :


The Energy Regulator agrees with Eirgrid on the impact of gas prices on wholesale
prices (PSO Paper) :


The lower estimated wholesale price for next year is reflective of a trend in recent months
in the SEM of lower spot and forward contracting prices, related to lower gas prices.

  But there may well be situations where high wind penetration coincides with peak demand during 
winter months. In this situation, wind could prevent peaking units from been used. Peaking units 
include oil and open gas cycle generators and are the most expensive form of generation hence why 
they are last in the merit order. In this situation, wind will bring down the wholesale price as it would prevent 
the market price from been derived by the high price bid by these peakers. 

But likewise, there will also be times when wind output will fall off quickly resulting in the need 
for quick acting peaking units like oil or ocgt to step in pushing the market price upwards. 
This is what may well have happened on the 15th January 2015 :


So to conclude, there will always be some form of gas generation in the system regardless of how
much wind is allowed in (due to system and balancing constraints). There may be slight reductions in 
the wholesale price where mid merit gas plant is prevented from been taken but as can be seen in 
the example above even with circa 1,700 MW of wind, mid merit plant is still required to balance 
the grid.  There may be occasions when wind prevents expensive peaking plant from been taken 
but there will also be occasions when sudden fall offs in wind power require expensive fast acting 
expensive plant to fill the gap.    

If anybody wants to submit an article on how wind energy does reduce wholesale prices, then please 
send to irishenergyblog@gmail.com and I will be happy to publish it.

But I will finish with an interesting question - what will happen the wholesale price if say, 75% 
wind is allowed into the system ? At this level, back up gas plants will be running on low loads, and 
potentially burning more fuel than if running more efficiently at higher loads. This will mean that 
the cost of providing the last MW of gas power will be more expensive than in the little or 
no wind scenario.

So will we see upward pressure on the wholesale price in this case ?     


Saturday 2 May 2015

Cost Benefit Analysis obligations for Ireland's Renewable Action Plan - Part Two


What has been the benefit to date from our expenditure?

By Pat Swords BE CEng FIChemE CEnv MIEMA


Ireland's Renewable Energy Action Plan (NREAP) was prepared in 2010 without any proper assessment of costs and impacts. Table 10 of the NREAP provides us with the bottom line on electricity generation, namely by 2020 the installation of 4,094 MW of onshore wind and 555 MW of offshore wind. For wind energy installed in Ireland, where project costs are higher than elsewhere, approximately €2 million per MW is the installed cost for onshore installations and at least €3 million per MW for offshore installations. This then gives a total cost for installed wind energy of almost €10 billion.

Additional electricity infrastructure is required in transmission to facilitate wind energy, already we have had the investment in the East West Interconnector to Wales at €0.6 billion, with more and even longer interconnectors to come to the UK and France – as described on page 79 of the NREAP. As a result the total cost of such interconnectors will conservatively come to another €3 billion.

In the Republic of Ireland there is the roll out of Grid 25 to expand the high voltage grid, for which an accurate cost is not known, but it is reported as some €4 billion and will undoubtedly rise, as the Energy White Paper of 2007 stated:

  • We will ensure completion of the ongoing capital investment programme in transmission and distribution networks by 2010 and oversee further extensive investment in a programme expected to total €4.9bn up to 2013.

Not only is there over 800 km of new high voltage lines to be constructed in Grid 25, but as the All Island Grid Study demonstrated, there is an additional 5,000 km of medium voltage grid connections required to connect all these wind farms to the high voltage grid. For instance, in November 2011, the European Investment Bank, i.e. the EU’s bank, lent the ESB some €235 million for network expansions to facilitate increased deployment of wind energy. Further similar loans totaling €300 million followed in 2013 and 2014. Their total loans to the ESB to facilitate network expansions for wind farms in Ireland have by the end of 2014 totaled €1 billion.

So between high voltage and medium voltage grid expansions, plus interconnectors, there is a bill of some €8 billion, for which if we add the turbines, the total now reaches €18 billion. However, we are not done yet, as the electricity grid is now, with all this wind energy, in an unstable state. As a result it is necessary to roll out so called ‘smart meters’ to regulate consumers and their demand habits. These smart meters are described on page 77 of the NREAP and for their funding; we can throw in another billion or two into the financial pot.

However, this won’t ‘cure’ the fundamental problem the grid will experience, as more and more highly intermittent wind energy is installed and given priority access over conventional thermal power generation. As the former Green Party leader and Minister for Environment John Gormley's stated in his ‘Carbon Budget’ of October 2008:

  • The target is underpinned by analysis conducted in the recent All Island Grid Study which found that a 40% penetration is technically feasible, subject to upgrading our electricity grid and ensuring the development of flexible generating plant on the electricity system.

In essence we will have to mothball our current base load Combined Cycle Gas Turbines (CCGTs), which although they cannot rapidly respond to changing loads, have efficiencies over 55% and greater. New open cycle fast response gas turbines, which are at best only 40% efficient, will have to be built to replace these CCGTs:


Efficiency curve for an aero-derived gas turbine, LM2500+, which is typical of the technology, which is used for open cycle gas turbines


Equally as bad as the poor efficiency obtained with these open cycle gas turbine, is how their emissions start to rise significantly at lower loads:


Emissions profile for a LM2500+ gas turbine

So given that a the UK authorities report that the installed cost of a CCGT is £0.9 million per MW and the installed cost of an open cycle plant (OCGT) about £0.6 million per MW, and we will require at least 1,000 MW of fast response power to balance the grid fluctuations, there is going to be no change out of another billion Euro in terms of investment in new plant and premature write offs of CCGTs.

So all in all over €20 billion plus was committed in capital investment alone as a consequences of the NREAP. By 2015 we have already installed 2,100 MW of wind energy, plus the East West Interconnector and network upgrades as previously highlighted, so we have spent quite conservatively €6 billion already. To that you have to add the operating costs, profit for the wind investors and the costs of inefficient operation of the grid. So it is not surprising that in their 2014 submission to the Irish Green Energy Paper, the Irish Academy of Engineering pointed out:

  • Without wind generation, Ireland’s electricity generation costs in the period 2005 to 2013 would have increased by 1.2 cents per kWh due to the increased cost of imported fossil fuels. But over the same period, Ireland’s business electricity prices actually increased by 4.0 cents per kWh and household electricity prices increased by 8.85 cents per kWh. This clearly shows that increased fossil fuel import costs were not the cause of electricity price increases in Ireland but rather government policies which did not place appropriate emphasis on price competitiveness.

Considering that the Irish domestic electricity rate is between 19 and 20 cents per kWh, to which additional levies are applied, clearly without wind energy, the rate would be a third less, around 12.5 cent per kWh. This is not an isolated issue; the Union of the Electricity Industry – Eurelectric had a report produced by Accenture in 2014, which provides the rather sobering graphic of how costs to the consumer are soaring, in particular due to Renewable Energy Sources (RES):

Graphic from Eurelectric report

It is also worthwhile reflecting some more as to the so called reason and what we got for this in terms of environmental protection. If we consider Ireland’s first application for State Aid to establish the first phase of the REFIT scheme for supporting 1,450 MW of almost exclusively wind energy, then the 2007 clarification documentation with the EU Commission, in respect of what environmental results were anticipated and over what period, stated:

  • Wind technology will be the dominant technology. The overall environmental improvement, based on wind technology data, will deliver emissions savings as indicated in the following table.

Table A

Emissions
Annual savings per 100 MWs installed
Tonnes of oxide

Carbon Dioxide
0.19 ml

Sulphur Dioxide
4k

Nitrogen Oxides
1.3k


Ml = millions
k = thousands

It was therefore claimed back in 2007, as basis for the 'environmental protection' to justify the State Aid funding that for each 1,000 MWs of installed wind energy capacity, 1.9 million tonnes of CO2 savings would result. So what did we actually get for our money?
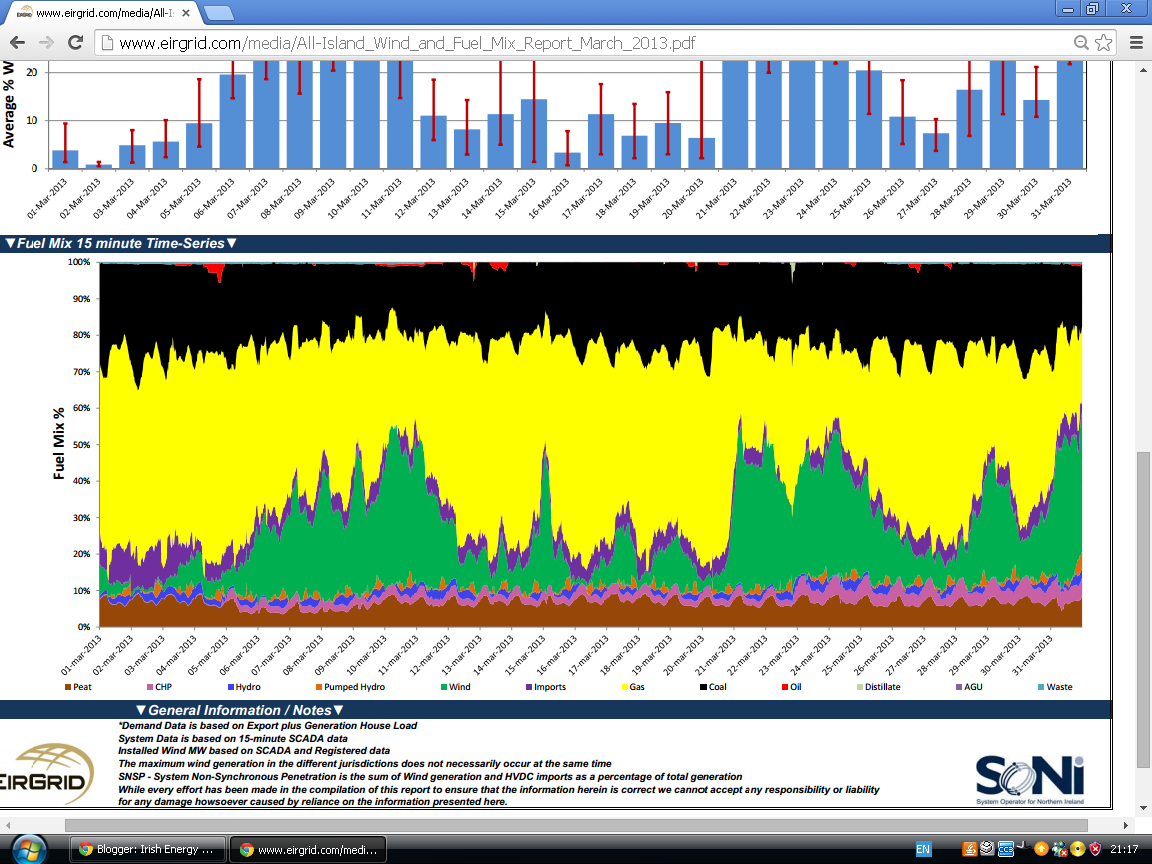
If we go to the National Renewable Energy Action Plan (NREAP) progress reports to the EU, we can see that the Irish report dated February 2014 claims 1,763 MW of wind energy were installed by 2012 and 2,738,072 tonnes of CO2 savings occurred that year. If we look at Table 1 b of the same progress report, then wind energy was responsible for (4,247 / 5,659) or 75% of the renewable electricity, therefore 2.05 million tonnes of CO2 savings.

This is equivalent to 2.05 / 1.763 = 1.17 million tonnes of CO2 savings per 1,000 MW of installed capacity – certainly not what was claimed for in the REFIT documentation.

However, we do know this ‘saving’ documented in the NREAP progress report is also completely inaccurate, as the calculation method is false. Namely, the calculation method does not allow for the considerable inefficiencies induced on the grid, by this intermittent input of wind energy, which requires the power stations to operate in a stop start variable manner, i.e. increased balancing. As page 29 of the Irish NREAP progress report clarifies:

  • The limitations and caveats associated with this methodology include that it ignores any plant used to meet the associated reserve requirements of renewables. These open cycle plants will typically have lower efficiency and generate increased CO2 and NOx emissions compared with CCGT and these emissions should be incorporated into the analysis. The purpose of presenting a simplified analysis here is to provide initial insights into the amount of fossil fuels that are displaced by renewables and the amount of emissions thereby avoided.

Note: Open cycle gas turbines are at best 40% efficient as compared to Combined Cycle Gas Turbines (CCGT), which are 55% efficient.

As the Sustainable Energy Authority of Ireland (SEAI) has been criticised for inaccurate claims, they produced another report quantifying fuel and emissions savings, this time where they claimed their modelling output allows for inefficiencies on the grid. The conclusion of this revised report was that for 2012, wind energy saved 1.5 million tonnes of CO2.

Therefore with this more in-depth assessment methodology the claimed savings are now at 1.5 / 1.783 = 0.85 million tonnes of CO2 savings per 1,000 MW of installed wind capacity. Sadly, this is actually less than half (45%) of what they claimed would occur when REFIT was initiated back in 2007 to fund the building of this infrastructure in the first place.

Furthermore, it has to be said that the SEAI report above is highly suspect, in that it is based on computer models, which concluded that increased ramping up and down of gas plants occurred, for the situation where there was no wind installed on the grid. Yet it is well known that power plant operators are complaining that the degree of ramping is now greater to compensate for the increased wind energy input. Indeed, the whole grid is being redesigned, not with the goal of fuel efficient generation, but instead to prioritise fast response, as recent documentation from the Irish grid regulator on this subject demonstrates.

Not only are the 1.5 million tonnes of CO2 savings for 2012 somewhat exaggerated, but these savings are not going to get a whole lot better as the NREAP progresses. In 2004, Eirgrid produced a report on the “Impact of Wind Power Generation in Ireland on the Operation of Conventional Plant and the Economic Implications”, which clarified:

  • The adverse effect of wind on thermal plant increases as the wind energy penetration rises. Plant operates less efficiently and with increasing volatility.

In other words, it is a case of diminishing returns as more wind energy is installed to comply with the trajectory of the NREAP. For Ireland total greenhouse gas emissions in 2013 were 58 million tonnes, while electricity generation amounted to less than 11 million tonnes. So these savings on a national basis are extremely poor when compared with the reckless enthusiasm by decision-makers for renewable energy and their disregard for both the resulting financial and environmental costs. Plus, these alleged savings from Irish wind energy are only 0.004% of global annual emissions of carbon dioxide, which given that there has been no increase in global temperatures since 1998, is the classic case in terms of effectiveness of ‘a drop in the ocean’.