Monday 29 December 2014

What's in Your Electricity Bill : Part 2 - Constraint Payments

Constraint Payments


Summary:


  • Constraint payments are paid when a plant is forced to run differently to schedule.
  • These payments have risen since 2009 from €101m to €175m in 2014.
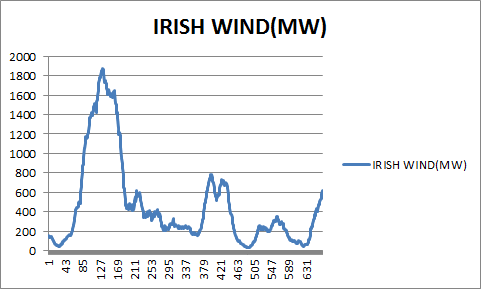
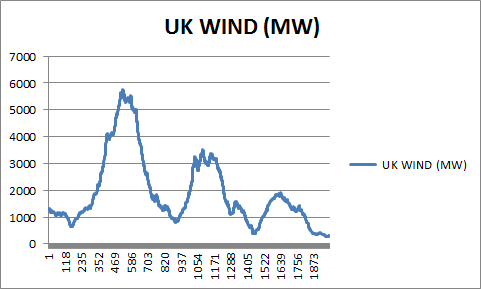
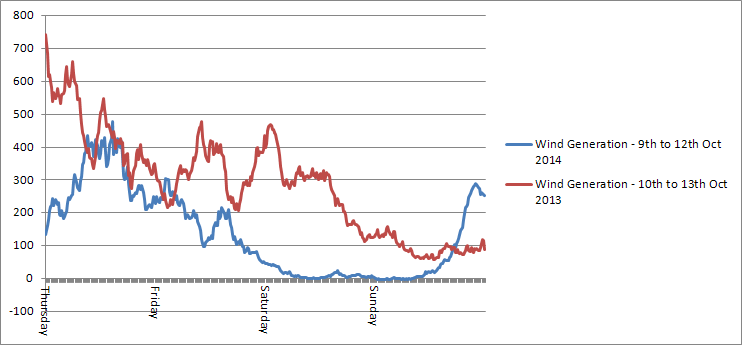
  • Years with good wind output (high capacity factor) coincide with those years that had high constraint payments
  • This is because wind is intermittent and must be taken by the grid when available (priority dispatch). This results in plant running differently to schedule more often than in a system with little or no wind.
  • The cost of constraints in 2014 was roughly equal to the claimed fossil fuel savings by SEAI for 2012.
  • Older plant have been replaced by modern efficient plant which require longer start up times but should result in more efficient use of fuel. But because wind is running in and out of the grid intermittently, the new modern plant are running less efficiently than they are designed to. This adds to constraint costs.

Constraint payments are a form of compensation for a plant when it runs differently to its scheduled production. I will explain this in further detail below but first of all I need to clear up a few things. There are different forms of constraint payments. The type of constraint payments discussed in this article are paid to conventional plant, mostly gas.  According to the Department of Energy, curtailment payments in the region of € 7.5 million were paid to wind farms in 2013. Curtailment and constraints are, confusingly, when talking about wind energy, two separate things - one is when wind farms are shut down due to local constraint problems, the other is because of national constraints e.g. when the SNSP 50% limit is breached. As far as I can discern, wind farms do not receive the type of constraint payments discussed in this blogpost, as they are not given daily schedules - instead, they get priority dispatch, if and when the wind blows (between cut in and cut out speed). However, wind energy does contribute to higher constraint payments for conventional plant as we will see.

Let's look at the annual constraint payments for the last few years :


Annual Constraint Payments paid to conventional plant
(from SEMO http://www.sem-o.com/pages/MDB_ValueOfMarket.aspx)

2010 and 2012 were years with relatively poor capacity factors for wind. The other years had average to high capacity factors. In these years, we see higher levels of constraint payments as there was more unpredictable wind interrupting the scheduled generation for conventional plant . By 2014, the payments hit a peak of € 175 million due to two factors -  saturation of wind in the system and the new interconnector which provided power from cheaper sources such as coal.  We can see which direction the payments will go when we add more wind into the mix. To put the € 175 million into perspective, SEAI claimed that wind energy resulted in € 177 million in fossil fuel savings in 2012.

EirGrid and SONI foresaw these increased constraint costs in this report :

Wind is inherently a variable resource. The UUC market schedule [done after the event], with perfect foresight, can schedule the most economic generation to balance this variability as it knows exactly the level of wind output in every period. The TSO, on the other hand, since it is not always aware of the timing or extent of these variations, must balance them using a combination of part-loaded plant and more expensive fast-start plant. This less optimal schedule will cause an increase in constraint costs. 


They then go on to say :

The generation portfolio has changed in recent years due to closures of mid-merit plant such as Poolbeg Units 1 and 2 [blogger note - these are the two plant which used the famous, now redundant, chimney stacks in Ringsend, Dublin pictured above], and the long-term forced outages of a number of other mid-merit and flexible generation units, such as North Wall 4 and Turlough Hill. In addition, transmission constraints limit output from Aghada Unit 1 and the Aghada Gas Turbines at times, further limiting the available generation portfolio. This deficit of mid-merit units that can start with relatively short notice periods has resulted in a reduction in portfolio flexibility for reacting to unexpected changes in generation and demand. Previously, when these units were available, uncertainty over generation, wind and load could be managed within 1 to 2 hours using these flexible mid-merit generator units.
At present, any potential capacity shortages due to generation, wind and load uncertainty in the future require commitment decisions to be made a number of hours in advance due to the long notice periods required by the generator units available to meet these shortages. Operators are required to call units with long notice periods further from real time when there is greater uncertainty about forecast accuracy, thus increasing the likelihood that dispatch diverges more from the optimal solution.
These commitment decisions are made to mitigate against the risk of a capacity shortage
and to ensure that sufficient replacement reserve is maintained to deal with any further
changes to generator availability or forecast demand or wind. Availability of generation with shorter notice times would mean that such commitment decisions could be made nearer to real-time and with better information.
 
A provision of €3.8m has been included to account for divergence of dispatch from the
optimal solution due to generation portfolio changes. The return of Turlough Hill is expected to have a positive impact on the flexibility of the generation portfolio and the return of these generator units has been incorporated in the provision. So in otherwords, due to wind forecasting problems, there is further unpredictability in the system for conventional generators

So plant that could start up quickly (but were inefficient) were closed down and replaced with slower starting more efficient plant. This shouldn't be a problem as it should lead to more efficient use of fuel. But because it gets more difficult to forecast the wind accurately, particularly when at high penetration levels, you have to compensate these plants when they are forced off the grid by wind (which has priority dispatch) and forced to run differently to schedule.

Each plant is given a production schedule for the day. The older plants were given a schedule an hour or two before production because they could switch on quickly. But the slower modern plants have to be given their schedule up to 8 hours or more before production. The problem is that with high levels of variable wind in the system, this schedule is bound to change and plant must be compensated for these changes. Otherwise, they go out of business (which is not a good idea if you want to keep the lights on).

With wind energy now embedded in our electricity system and indeed in our energy policy, constraint payments are something we will all be paying for long into the future. It is another example of how wind adds complexity to the electricity system. A general rule in economics is that complexity costs money. You can imagine the level of office staff required to calculate the above for each and every plant in the country each day of the year. While nobody begrudges anybody a job, surely a limit needs to put on these added complexities if we want to remain competitive.


Friday 26 December 2014

What's In Your Electricity Bill : Part 1 - Energy Payments


Energy Payments


This is the first part of a series of blog posts on electricity bills beginning with Energy Payments.

Summary:


  • Energy Payments cover costs incurred by generators in power generation e.g fuel.
  • Energy Payments were € 1.7 billion in 2010 (poor wind year) and €2 billion in 2014 (good wind year)
  • Wholesale prices have had little effect on the increase in Energy Payments since 2010
  • Demand has fallen since 2010 but Energy Payments have increased
  • Strong wind output leads to higher Energy Payments because of the subsidies it receives
  • Strong wind output leads to lower wholesale prices but higher Energy Payments which are reflected in higher electricity bills
  • Capacity Factor is a measure of the output of wind in percentages, It indicates how much electricity a generator actually produces relative to the maximum it could produce at continuous full power operation during the same period. So 100% would be where the wind output would reach its maximum every day for a whole year and 0% where there was no wind output for a whole year.


Energy Payments make up a large portion of most electricity bills, sometimes as much as 50%. This covers fuel costs and other costs incurred by generators during the operation of their plant or wind farm. It is paid to generators based on power supplied to the grid. Theoretically, as wind has no fuel cost, energy payments should be lower in a system with wind than one with fossil fuels only. But in reality, wind energy receives a higher payment from the market than fossil fuel sources do and this has driven up energy payments. 

2010 was a particularly poor year for wind in Ireland. Capacity Factors dropped to 24%, the lowest its ever been. So this is a good year to use for comparative purposes as nearly all the electricity was generated by fossil fuel and conventional sources.

SEMO's (the market operator) year runs from October to September but we can still use their annual figures as an indication as to what is happening. The 2014 year was a pretty average year for wind with some of the largest and lowest monthly capacity factors but with the largest installed wind capacity on the system to date. When compared to 2010, there were much higher levels of wind penetration in 2014 with an average capacity factor of 29% for the SEMO year to September 2014. 

In 2010, total Energy Payments were € 1,752,491,743. In 2014, it rose to € 2,029,397,823, an increase of € 277 million or 15.8%. Average demand dropped by about 2% in this period so this increase is not because we used more electricity. What about the price of fossil fuel ? The price of fossil fuels, mainly that of gas, is one of the biggest drivers behind the wholesale price, so we can use this a good indicator. The wholesale price rose by € 12.28 MWh (23%) between 2010 and 2014 according to the CER (from €52 to €64.28). So maybe the hike in Energy Payments was because of the rise in fossil fuel prices ?

There are 2 issues here:

1) One of the alleged advantages of Wind energy is that it acts as a hedge against high fossil fuel prices. Installed wind capacity increased by around 50% (700MW) in the period we are looking at and as explained capacity factors (i.e. wind output) were much better.  The wind industry will argue that wind energy helped to retard the above growth in wholesale prices, due to the high cost of fossil fuels.

2) The highest wholesale price in recent times was in 2011/12 when it hit € 72.72. The following year the price dropped by €7.00 MWh (9%). But Energy Payments did not drop in line with this. In fact, they rose by €191m (coincidentally 9%). So the reductions in fossil fuel prices did not trickle down into less Energy Payments as one would expect. Instead, consumers paid more.

So what exactly is happening here ? Well, we need to take a "birds eye" view. Generation capacity with priority dispatch is increasing (i.e wind), replacing power from other capacity in the grid. But wind energy is a more expensive way to generate electricity due to the REFIT subsidy given on the market price.

So the cost of using more wind energy is an important factor. The variations in the price of fossil fuels has impacted little over the past few years as can be seen below. The cost of adding more wind has more than offset reductions in fossil fuel prices.

In fact, the capacity factor of wind seems to be the single largest driver in the rise (or fall) of Energy Payments. Take a look at the following graph. I have represented all the above factors as percentages to allow comparison, with the highest of each factor since 2010 shown as 100% :

Energy Payments provided by SEMO. Wholesale Prices provided by CER in PSO Levy papers. Capacity Factors
and Installed Wind Capacity provided by Eirgrid.


 There doesn't seem to be much correlation between wholesale prices and energy payments. But the correlation between Energy Payments and Capacity Factor of wind (output of wind) is striking. So when we get a year with good wind speeds, the electricity bills go up.

There does, however, appear to be a negative correlation between wind output and wholesale prices, i.e. when there is a high wind capacity factor, the wholesale prices comes down (and vice versa). But the Energy Payments go up to pay for the additional wind energy.

And the only thing that matters to consumers is the cost of Energy Payments as we have seen in our bills. It is of little consolation to them that wind energy has lowered the wholesale price when retail prices have shot up.


Wednesday 24 December 2014

Growing calls to scrap wind subsidies


Wind energy is the only source of energy in Ireland that receives a market price subsidy for electricity generation. This is known as REFIT (Renewable Energy Feed In Tariff) and is subject to EU State Aid clearance. The only fossil fuel related EU State Aid in Ireland was for the Northern Irish gas pipeline, a vital piece of infrastructure that links up Britain's gas reserves to Ireland. The current REFIT is due to expire in 2017 and it does not makes sense, considering our relatively high electricity prices and the fact that wind energy is now a mature technology, to renew it. In April 2014, the European Commission adopted new rules on State Aid given to renewables :

The European Commission has adopted new rules on public support for projects in the field of environmental protection and energy. The guidelines will support Member States in reaching their 2020 climate targets, while addressing the market distortions that may result from subsidies granted to renewable energy sources. To this end, the guidelines promote a gradual move to market-based support for renewable energy.

It remains to be seen how the Irish government deal with these new rules as some flexibility in their adoption has been granted.

There are many distorting claims made by lobbyists such as wind is free, but the fact is that wind energy currently receives a fixed market price plus a 15% kicker thanks to REFIT. Another claim made is that fossil fuels also receive subsidies. Again, this is a distortion - no fossil fuel generation receives a fixed subsidy on the market price in Ireland. All sources do however receive tax breaks, which is a form of subsidy.

A recent NERA report comparing the taxation and subsidy regimes applying to oil, gas, coal,
wind, and solar power in the EU28 and Norway during the period 2007-2011 has found
that EU28 (+Norway) governments receive far greater revenues from oil, gas and coal than these
energy sources receive in the form of direct subsidies or other transfers. Oil is by far the largest
contributor to government revenues. In contrast, wind and solar power are net recipients of
support.

There are now growing calls from many independent organisations and companies around the country to abolish REFIT once it expires in 2017. The only groups now proposing the continuation of the scheme are those who stand to profit from it. Below is a list of organisations now advocating its abolition with the relevant quote from their submissions on energy policy made in July 2014.


Boliden Tara Mines

Of particular importance to us as large energy users would be clear definition of the ongoing
requirement for support schemes such as the Capacity Remuneration Mechanism for
electricity generators, the Public Service Obligation levy and Renewable Energy Feed-In
Tariff (REFIT). These support measures, which were seen as necessary in the context of
energy policy direction in 2007 and have largely achieved their objectives in the intervening
period, should be subject to review in the context of the dramatically changed energy
environment and the disproportionate burden which they impose on large energy users.


Bord Gais

Also, although REFIT and priority dispatch have worked well to drive the initial investments required, they are not sustainable support structures in the long-term as we seek to diversify our low-carbon resources and to integrate our market(s) with the wider European market(s). As discussed earlier, a single carbon price (perhaps through a carbon floor price in the absence of a robust carbon price) with equal access to markets for all technology on a cost competitiveness basis may better support diversity in Ireland’s sustainability solutions. 


ESB

We fully support Government’s target of 40% RES by 2020 and the EU regulations
that underpin it as we believe that both provided a really strong kick start to the RES sector and
the wind sector in particular. However we believe that further RES targets beyond 2020 and
accompanying support schemes should be discontinued for mature technologies such as Wind
and Solar. Instead we believe that continuing decarbonisation of the electricity sector should
be driven by a strengthened EU –ETS. Our reasoning behind this is as follows:
 - By 2020 the RES industry will have operated on the back of subsidies for some 20 years
and there comes a point when such subsidies should be discontinued both in the interest
of producers and of consumers.


Forfas / Enterprise Ireland / IDA

An increasing share of Ireland’s generation capacity is subsidised.  This is not sustainable.  It is critically important for the effective functioning of the all island electricity market that renewable generation capacity is subject to market forces to the greatest extent possible.  As a mature technology, price supports for new onshore wind projects should be discontinued when REFIT 2 ends in2017.  Enterprise opportunities in emerging energy technologies should be funded through funding mechanisms for R&D, if deemed competitive, rather than by energy customers;


Indaver Ireland

In developing any future support mechanisms, the recent European Commission State Aid Guidelines must clearly be taken into account. These require that supports move increasingly towards providing only a market premium, and being made available through competitive bidding.


Irish Hotel Federation (IHF)

IHF recommends that the PSO system be abolished in terms of the current revenue
collection mechanism. Where such support is needed, the cost should be borne by
the Exchequer because the supposed benefits are available to the entire society.

 As noted above in the context of prices, the PSO system and other systems of supporting
alternative sources of energy need a fundamental review to ensure the most effective
approach is being adopted. The IHF considers that whatever subsidies and supports are
temporarily justified to support renewable energy sources, should be financed by the
exchequer rather than user levies. The IHF again refers to the need to ensure that alternative
sources such as wind farms do not diminish the scenery aspect of the Irish tourism product.
Wind farm and wave energy development should take account of possible impacts on
tourism.


Lagan Cement

The policy behind the aggressive development of wind energy needs to be framed on
a commercial cost competitive basis. It should be envisaged that wind energy can be
built and operated without any government/ end user subsidy. 


National Competitiveness  Council (NCC)

From Irish Times Article, 3rd December 2014 - The Government should wean the renewable energy sector off State supports, says the National Competitiveness Council (NCC), and it warned against promoting over-investment in new electricity generation capacity.


In a report to be published on Wednesday, Ireland’s Competitiveness Challenge 2014, the State’s competitiveness watchdog says price subsidies for onshore windfarms should be scrapped in 2017 as it is a “mature technology”.

“It is critically important... that renewable generation capacity is subject to market forces to the greatest extent possible,” it said.


The NCC, whose members include the heads of Google and Paypal in Ireland as well as several other employer and trade union representatives, said the focus of the electricity market should be on delivering new electricity for the cheapest possible cost.


The following are those advocating a reduction or a review of REFIT rather than its discontinuation :

Rusal Auginish (Combined Heat and Power)

The Green Paper references Ireland's Strategy for Renewable Energy. Renewable energy is
important for delivering a low carbon economy and it has already received substantial support e.g.
REFIT. We would urge caution about the govemment putting all its eggs in one basket so to speak
and a mix of energy sources should be considered, in particular LNG and further indigenous gas. We
do agree with continued support for "Renewables" but not for the mature technologies which should
compete in the market based on the value they deliver i.e. carbon savings. A possible approach couldbe that any additional costs incurred by non-renewable generators as a result of non-reliable,
intermittent, non-synchronous generation should be borne by the renewable generators directly (hencewhy they are subsidised). Otherwise, the failure to adopt this approach is effectively a Govemmentcharge / tax on the energy consumer i.e. a further cost to the energy consumer to support renewable generation.

Page 59 of the Green Paper discusses a new support scheme for renewables from 2016
and the paper notes that onshore wind is now becoming a mature technology and hence less support isrequired. Aughinish supports a reduction in support for mature renewables.


SLR Consulting 

The REFIT price is an appropriate support mechanism that gives an element
of revenue certainty to the developers of renewable projects. However, it should be
adjusted for new projects in the future to take account of the reduced cost of
renewable technologies.


Competition Authority

Renewable generation of electricity through wind turbines provides sustainable energy from an indigenous source, but it is not without costs. While renewable energy can provide cheap wholesale energy prices, it can raise the cost of conventional generation, which will always need to be available for days when wind doesn’t blow. The approach to subsidising renewable energy could be fine-tuned to prevent over investment in wind projects which may not be necessary. For example, the length of the guaranteed price of 15 years under REFIT seems very long as technology can change a lot in that time and the long period can increase costs. The cost implications of individual policy decisions should be recognised in the formulation of future energy policy.

[Note: I have contacted TCA to clarify their position and would urge others to do the same. When/if I receive a reply it will be posted on here]


Association of Irish Energy Agencies (AIEA)

 A clear long term transparent carbon tax inflation methodology should be utilised that reflects the UK’s REFIT system that decreases REFIT as targets are achieved.


Kore Energy (energy procurement services)

Of particular importance to large energy users would be clear definition of the ongoing requirement for support schemes such as the Capacity Remuneration Mechanism for electricity generators,  the
Public Service Obligation levy and Renewable Energy Feed‐In Tariff (REFIT).  These support
measures, which were seen as necessary in the context of energy policy direction in 2007 and
have largely achieved their objectives in the intervening period, should be subject to review in
the context of the dramatically changed energy environment and the disproportionate burden
which they impose on large energy users.


Apart from the usual lobby groups and state boards, Bord Na Mona, Carlow Kilkenny Energy Agency, Cork Institute of Technology (some form of subsidy), Coillte, Cork City Energy Agency, Energia, Energy Cork, Matheson, RES and SSE Airtricity want the lucrative subsidy to continue. There are others who want it expanded to small community owned wind farms and other sources of renewables.

Let's hope the Irish government push the red button this time before things go out of control.........


Thursday 18 December 2014

Response to Ernest & Young


Ernest & Young, the accountancy firm, made a submission on the Green Paper, which I found interesting, as apart from the financials aspect, I'm not sure what expertise they have in the energy sector and specifically, electricity generation.

Over time, encouraging the acceleration of electric vehicles will increase the load for variable generation at times where theremay be surplus wind generation (i.e., at night), thus providing additional benefits to the electricity system and simultaneously driving down transportation costs.

This is a common misconception. Firstly, wind is a product of the sun, so the best wind generation tends to occur during the day. Secondly, they fail to mention that transportation costs may go down but electricity costs will increase. Costs are simply transferred from one sector to the other.  But the main problem with this is that it would lead to demand for additional dispatchable capacity*. One night there might be high levels of wind generation. The next night there might be zero levels of wind generation. On the second night, dispatchable plant will be required equal to every MW of wind generation capacity. So a duplicate system would need to built and funded by the consumer instead of one. I shudder to think of what our electricity bills will look like then.

Over time and as technology solutions evolve, allowing electric vehicles to inject surplus electricity onto the grid (i.e., whenparked), will provide additional ancillary services to the system.
I am completely baffled by this concept. Perhaps someone can enlighten me ? Surely if I want to drive from Dublin to Cork tomorrow morning, the last thing I want to do, as I leave my car parked outside the night before, is to have it exporting electricity to the grid ?

Replacing Moneypoint as a baseload generator when it reaches the end of its useful life will be a key challenge to the market.The options will be to convert to other fuel types, upgrade it to include carbon capture facilities, or ensure that there is sufficient diversification and availability of other types of generation such that it does not need replacing. This latter option would be the ideal from an energy security and sustainability perspective but will require significant innovation around the operating and design of the future electricity system.

The latter option would not be ideal from a stability and reliability point of view as the Grid Regulations states:
There must be at least one Moneypoint unit on load at all times. Required to support the 400kV network. 
So Moneypoint most definitely needs to be replaced. It simply is not an option to do otherwise unless one wants to create blackouts in West Ireland. Biomass, SMRs (small nuclear reactors) or indeed cheap coal power are some of the options. It is a cop out to try to say otherwise. In economic terms, its like saying that we don't need to increase taxation or reduce spending when there is a budget deficit. Friends of the Earth made a similar suggestion regarding Moneypoint - it might sound nice and fluffy but the laws of physics do not respond well to emotions.

However, I don't disagree with everything in their submission:
Natural gas is the friendly fossil fuel with least environmental impact. The [Compressed Natural Gas] technology is well tested as there are over 14 million natural gas vehicles (NGVs) worldwide with around 11% growth per annum in Europe. The use of CNG as a transport fuel will have a positive impact on the energy security as it will reduce the dependence upon oil imports. Also, supply of natural gas through pipelines connected with the UK beneath the Irish Sea is more stable than oil supply from the Middle East. The national grid infrastructure can be used to ensure effective distribution. The option of blending CNG with bio methane will provide additional diversification of fuel mix and therefore additional energy security. NGVs produce about 13–21% fewer GHG emissions than comparable gasoline and diesel vehicles.If bio methane is blended with natural gas in a 10/90 ratio,the carbon emissions reduce further. Using pure bio methane reduces carbon by roughly 90%

Compressed Natural Gas (CNG), is certainly something worth looking at. In Delhi, India, all city buses operate on CNG resulting in less city pollution. For those interested, a summary of Delhi's transition from diesel to CNG can be found here:

By 1st December 2002, the last diesel bus had disappeared from Delhi’s roads, as part of a programme to improve public transport by offering more busses, and only busses running on CNG.
How was this achieved? Companies could either buy new CNG busses, at a cost of 1’600’000 Rupees (16 lakh), replace the engines of existing busses at a cost of 700’000 Rupees, or convert the diesel engine of existing busses to CNG, at a cost of 400’000 Rupees.
The majority of business went for the option of buying expensive new CNG busses; 2’800 opted for the cheapest solution of engine conversion; no existing busses were equipped with new CNG engines.
It is interesting to note that only 3’000 busses are operated by the Delhi Transport Corporation, the majority of the busses in Delhi are run by private operators. Approximately one thousand additional busses that link Delhi with neighbouring States still run on diesel; they are allowed to enter Delhi for a distance of 16 km maximum.
With the introduction of CNG came problems of conversion quality and maintenance quality; 12 busses caught fire. Foreign experts were called in to examine the problem[2], and a new regulation on CNG safety was published. One main problem was the absence of stress relief loops on CNG installations – a problem not limited to CNG and India, which led to the banning of LPG cars in Europe not equipped with pressure relief equipment.

Apparently, some city bus fleet in Cork have already been tested with encouraging results :


If only all new energy concepts were carried out on a trial basis.......


*Dispatchable plant is plant that can be switched on or dispatched when required to do so and includes fossil fuel, biomass and nuclear sources of generation.

Tuesday 16 December 2014

Academy of Engineering issue stark warning about implications of continuing with current Energy Policy


It seems that the deeper a nation gets trapped in a bubble, the harder it is for politicians and those in power to turn back or at the very least put the brakes on. The Irish Academy of Engineering have issued a brief two page document that makes for sober reading for all those households and companies struggling to pay the bills. It can be read here:

http://www.iae.ie/publications/publication/iae-bulletin-no-4-implications-of-continuing-with/

At current price differentials it [extra windpower] would add €200 million to the annual cost of electricity.

It would involve additional capital expenditure of between €1 - €2 billion to integrate this
level of Windpower into the grid. (The entire Exchequer capital program for 2014 is €3.3 billion)


The EU Environment Commissioner has observed that for environmentally sustainable policies to be
effective they must also be economically sustainable. This is the kernel of the issue in relation to
agreeing policy initiatives. Making a fundamental change in Irish energy policy reflecting current
economic circumstances is a major issue.

However, it seems almost certain that politicians won't take heed of the ever increasing warnings coming from independent bodies and economists. As a Victorian gas network campaigner in England recently said:

It is a safe bet. Nobody will get fired for making this decision

It's a similar phrase to "Nobody ever got fired for choosing IBM" meaning that if you don't want to risk losing your job, don't evaluate alternatives, simply pick the safe option. We saw this during the housing boom. The Irish government are now making a bet on wind energy. They will say that nobody warned them at the time of the significant over capacity problems and costs with building a system around wind energy, that conventional wisdom (i.e. lobbying groups and the media) told them it was a safe bet at the time.

But since when did the Irish landscape, rural amenity and the right to affordable access to reliable electricity go up for grabs ?


Saturday 13 December 2014

Parasitic Consumption of Wind Turbines


The below post is intended for debate purposes only and conclusions are based on evidence made publicly available. I do not have access to any commercial sensitive data or other data not made publicly available that can confirm the following conclusions.

An interesting element of the current energy policy is that, with all the new wind farms scattered around the country, the demand for power has risen among our generating fleet, whilst in the other sectors of our economy it has decreased.  The power used from the grid by generating units is known as house load or parasitic power.

We can show how much parasitic power is now potentially been used by our wind turbine fleet by looking at data from Eirgrid on a windless day(s). During these days, wind turbines will often used grid power to continuously turn their naccelle to face the direction of any small gusts that may arise in the area. This is in contrast to a strong windy day, where the prevailing wind will be coming from one direction, so the nacelle will remain fixed in that direction for as long as the weather system lasts. They also use grid power in calm cold conditions to ensure that the blades don't freeze.

To demonstrate this, first of all lets look at the demand profile for two periods of 4 days (Friday to Sunday) in October 2013 and October 2014. Each trough and crest represents one day.


As expected, the demand is identical for both years. The first two weekdays in both years reach nearly 4,000MW at peak, and at the weekends reach about 3,500MW. There are no large industries that have relocated here in the meantime, nor any serious economic upturns, or booms, that could result in larger demand for this year. Ireland's economy is still sailing along in post-recessional / bailout mode. By the way, we wouldn't be expecting any large energy intensive industry to have relocated here because of our soaring electricity prices but that's another story. Here is another period with the same type of profile:


Wind generation was average to good during the above periods. Now, let's look at the wind generation profile from the previous period :


The blue line shows that this year, the wind output was particularly poor, even reaching minus 3MW on occasions. The part we need to focus on is the second half of that graph, which covers the Saturday and Sunday when the wind was crawling along between -3MW and 10MW in 2014. We would expect that the wind fleet would have been using grid power during this time to try to pick up any gusts and that this power consumption would be much larger than in 2013. So lets look at the demand profile for these days:


On the first and last days (Thursday and Sunday), we can see the demand profiles are very similar but in the case of Thursday, the wind output is much the same for both years. On Friday, the wind begins to deviate towards lower outputs and we see a spike in demand. But this could also be attributable to a larger load from industry on Friday morning. Then on the Saturday, we see two spikes in demand - one of about 400MW and the other about 200MW. We are now back at weekday levels of demand, which is odd because the factories and offices are closed down just like any other weekend. These spikes on Saturday fit in nicely with the wind graph above, where by Saturday afternoon, the wind was non existent, and the wind turbines were struggling to pick up on any gusts. As they did this, they consumed quite large amounts of grid power. The amounts are actually quite shocking and unexpected. On Sunday, it appears that they gave up on trying to use grid power (which indicates that they are charged for it) to start the turbines.

Let's look at that Saturday demand profile in more detail :


There is slightly less demand from about 3pm to 7pm but I can't see how wind turbines could have used less power in 2014, since there were more of them, so it is most likely attributable to something else, perhaps load shedding. When we extract the data where the demand is higher - from 9am to 3pm and 7pm to 10pm - we arrive at a figure of 1,906MWh for total additional power consumed from the grid by the wind farms during this calm day (assuming all of it is due to wind turbine fleet). This doesn't include parasitic power used on average wind days which is not possible to see with this data. So the 1,906 MWhrs refers to grid power consumed only on very calm days when the wind fleet are trying to catch gusts and maintain standby power (i.e keep oil and parts warm etc). There are around 1,124 wind turbines in Ireland so it works out at 1.7MWh per turbine.

To put this in context, the average 4 bed house requires approx 6.8MWh per year. So the power consumed over 9 hours by our total wind fleet in Republic of Ireland was the equivalent of the power required for 280 four bed houses for a whole year or 102,000 four bed houses for one day.

A week later the IWEA were telling us how much power their wind farms had generated (they hit a record) but we never get told how much power they consume, particularly on very calm days.

What are the associated emissions from this extra demand for grid power and how is it possible to say that wind energy is "zero carbon" ?

It is important to state that I accept that I cant prove with certainty that all or some of this additional demand is directly related to parasitic consumption of wind energy but given that 2013 and 2014 demand profiles are generally a perfect fit (as above) and that this variation occurred on a weekend day when there is less scope for variation (factories closed etc), it is difficult to attribute the variation to any other factor. But of course, comments are welcome.

Thursday 11 December 2014

Lies, damned lies and Interconnectors


American author, Mark Twain once wrote :

Figures often beguile me," he wrote, "particularly when I have the arranging of them myself; in which case the remark attributed to Disraeli would often apply with justice and force: 'There are three kinds of lies: lies, damned lies, and statistics.'"

This phrase is aptly applied to any energy statistics where interconnectors are involved. SEAI released a report this week which showed that the carbon intensity of electricity had reached a new low in 2013 and that gas and coal consumed during the electricity generation process had fallen from the previous year. However, 2013 was the year that the East West Interconnector came online. This meant that those who only read the "Highlights for the Year" section (i.e. most of the Irish media) fell into Twain's statistics trap. As the SEAI explain on Page 24:

Imported electricity is also considered zero carbon from Ireland’s perspective under the Kyoto Protocol as emissions are counted in the jurisdiction in which they are emitted. This resulted in the carbon intensity of electricity dropping by 48% from 896 g CO2/kWh in 1990 to a new low of 469 g CO2/kWh in 2013. 
So EU Diktat allows us to transfer the emissions produced from 7.6% of our electricity consumption (of which 40% was coal) to our neighbours, the UK. The following graph shows that we import 25 times more energy that we export through the East West interconnector, as wholesale prices are currently cheaper in Britain : 

Average East West Interconnector energy flows (MW) from Eirgrid data

Surely if the EU were serious about members doing their bit for "climate change" then, the method of accounting for emissions and fuel use from interconnectors should be in the country of consumption not generation. Theoretically, (though technically impossible), a country could import all its electricity from other countries and claim to be "carbon zero". This allows countries to bear no responsibility for the energy it consumes. But then again, the EU are not good at taking responsibility themselves. As the Irish Academy of Engineers (IAE) noted :

As manufacturing has shifted from Europe to Asia, the EU has effectively outsourced the production of GHGs to other countries, particularly China. Global GHG emissions have not actually been reduced, but just relocated.

And industry will continue to move out as long as Ireland and the EU continue to pursue energy policies that don't take account of the need to be competitive. The American Chamber of Commerce Ireland made this plain in their recent submission on energy policy:
Energy costs in the US and a number of other competitor locations have fallen in recent years, generally as a result of greater use of unconventional sources, such as shale gas and oil. This is having profound effects on global energy markets and on the competitiveness of industry in the US. European energy prices compare poorly with the US, and within Europe, Ireland has prices that are among the highest.
The EPA were also issuing statements this week stating :
Greenhouse gas emissions from the Energy sector decreased by 11.1% in 2013 as power generation increased from renewable energy, including both wind and biomass.
Again, you had to read further on down the article to find out about the accounting method used:
There was also a significant increase (+220%) in electricity imported through the interconnectors – the associated emissions are not included in Ireland’s greenhouse gas inventory estimates. 

 So we have now reached the point of no return in terms of energy statistics. From 2013 onwards, it will be more difficult to establish the contribution (if any) renewables are making towards lower emissions and fuel consumption.

Sunday 7 December 2014

James Joyce and Climate Change


In James Joyce's famous book, Dubliners, there is an interesting passage from my favourite short story in the book, An Encounter:

He stopped when he came level with us and bade us good-day. We answered him and he sat down beside us on the slope slowly and with great care. He began to talk of the weather, saying that it would be a very hot summer and adding that the seasons had changed greatly since he was a boy—a long time ago.

Is there any veracity to this ? If we assume that this slice of oral history is based on Joyce's own childhood reminiscences, then we can work out what period the old man in the story is referring to. Dubliners was written in about 1904 and this particular story is about two boys mitching off school. James Joyce was born in 1882 which would mean he would have heard this bit of oral history around 1890-1895. If we assume the old man was in his seventies at the time, then this would put him being born around 1820. We can then test his claim by referring to the temperature record from Armagh, one of the longest temperature records on the planet :

http://onlinelibrary.wiley.com/doi/10.1002/joc.1148/pdf

Figure 7 shows that the pre-1820 period was cooler than the period that followed:


The above paper concluded :
Long-term trends are seen in both seasonal and annual mean temperatures, with spring and summer series relatively flat compared with autumn and winter. Prior to 1820 we note that autumns and winters were cooler by ∼1 °C. Later, we note a significant warming in the mid-19th century, which started in the late 1820s and continued till c. 1870. A cool interval at the end of the 19th century was followed by a period of rising mean temperatures that lasted till the mid-20th century. Finally, a slight cooling from 1960 to 1980 was followed by a gradual warming over the past two decades. In spite of the current warmer conditions, annual mean temperatures still remain within the range seen in the previous two centuries.

So James Joyce grew up in a warmer climate than that of the old man and it's interesting that the old man refers to the summer going to be "very hot" as this ties in with the above data as things begin to warm up again around 1895. But with all the talk about climate change and rising temperatures today, the records show that the annual mean temperatures in the past 100 years have not moved outside the range of Joyce's and the old man's time.

The Valentia temperature record is the most reliable source as it provides data not compromised by urban heat :

Mean Air Temps

So we can see that the temperature rose consistently above 11C in the 1990s and 2000s but there were periods in the past when it exceeded 11C aswell so we are still within ranges that people in Joyce's time experienced. Indeed, if we look at the latest annual mean temperature records from Valentia we can see that last year we were barely at 11C. While this year we are just over 11C at the time of writing with December turning out colder than the previous three years. So there is nothing terrifically extraordinary about recent temperatures in Ireland :


Mean temperature in degrees Celsius for Valentia_Observatory
YearJanFebMarAprMayJunJulAugSepOctNovDecAnnual
20147.46.77.910.411.414.716.314.715.612.39.77.8*11.2*
20137.67.06.18.310.313.217.315.914.813.38.28.410.9
20129.08.810.110.211.513.314.415.713.510.88.08.311.1
20115.58.37.911.611.912.313.914.014.112.511.28.411.0
mean7.37.28.29.411.613.815.415.414.111.79.37.810.9
*Mean temperatures for 2014 as at 7th December 

There is an interesting article on the Armagh observatory website that puts the climate debate into context and explains just how complex Earth's climate system is. For example, scientists are still unsure as to what role clouds play in our climate :

The clouds are a main character in the climate scene, however their detailed role is yet to be determined. Climate models do not know how to deal with them. They play a double role, one the one hand they are bright and they reflect part of the radiation coming directly from the Sun back to space, having a cooling system because less energy arrives to the Earth surface. But on the other hand the Earth releases to space energy too and clouds can act as a blanket, trapping that radiation which should have escaped to the space in the same way as the greenhouse gases. Which of the two effects is going to dominate depends on the type and altitude of the cloud. Thus assessing their role in climate becomes nightmarish.

Of course, the sun also plays an important role in the climate system and the period that the old man grew up in is known as the Dalton Minimum, a period of low solar activity that lasted from about 1790 to 1830. This then accounts for the cool period that we saw above in the Armagh records.


Indeed, the old man would have lived through the transition of The Little Ice Age, a period of cooling that occurred between circa 1550 and 1850. NASA claim that this period was marked by a rapid expansion of mountain glaciers in Ireland. So the end of the Little Ice Age would have been a recent memory for the older generation by the time of Joyce's birth in 1882.


We can see from the above graph that the climate has (surprise, surprise) always been changing. In the 1970s, when Tim Severin recreated Saint Brendan's voyage in the Atlantic, which occurred in 512-530AD, numerous references were made to the warmer climatic conditions Brendan experienced. This period is known as the Medieval Warm Period and the North Atlantic, where Brendan sailed to, was warmer than today. This allowed the Vikings to travel further north than had been previously possible because of reductions in sea ice and land ice in the Arctic. One wonders, if Tim Severin tried to publish his book today, when climate alarmism has become fashionable, if the climate police would be set on him.

So we can see that there was indeed veracity to the old man's claim in Dubliners, that it was cooler when he was a boy, and that it had warmed up in Joyce's time. Perhaps An Encounter was indeed based on some of Joyce's reminisces as a boy and the stories he heard growing up in Dublin.


Thursday 4 December 2014

The Correlation of UK and Irish Wind

Shock of the century - Ireland and Britain have similar weather systems !


Once again, there is talk of exporting Irish wind to the UK. It seems that the basic rules of supply and demand are not understood anymore. If you are going to supply a product, then it must be at times when the other party has a demand for that product. Otherwise, you end up paying them to take your product (See here for evidence of that payment structure in place for Irish wind).

As I type, (20:16 on 4th Dec) the latest update from http://smartgriddashboard.eirgrid.com/#all/wind
shows 355MW of wind for All Island. This is about 13% of total Irish wind capacity.

http://www.gridwatch.templar.co.uk/ shows 580MW, about 5% of total UK wind capacity. So right now, on a cold winter night in December, there is demand in the UK for Irish wind energy. But, we dont have it. In fact, we are importing 707MW from them.

Below shows the wind profiles for All Island wind generation in Ireland and wind generation in UK for last week - from 20th to 26th November. Make up your own mind.  Are there any major opportunities for exporting wind to UK ?

All Island wind generation for Ireland - 20th Nov - 26th Nov 2014
http://smartgriddashboard.eirgrid.com/#all/wind

UK wind generation 20th Nov - 26th Nov 2014
http://www.gridwatch.templar.co.uk

Have the Irish authorities actually worked out the correlation of wind between the two Islands for a whole year ? I don't know, but it looks like their UK counterparts have done.


Tuesday 2 December 2014

SEAI's Quantifying Savings from Renewables Report and the Impact of Wind on Reserve Requirements


Earlier this year, SEAI issued a report, which concluded that there was a saving of € 177 million in fossil fuel due to wind generation in 2012, titled "Quantifying Ireland's Fuel and CO2 Savings from Renewables". The report has a number of flaws. Here is a sample of some of those flaws :


  1.  For the "No Wind" model, it assumes that the wind capacity would be replaced by 180MW of OCGT. OCGT is the most inefficient form of gas generation and would therefore result in larger savings than a CCGT plant in their "2012 Base Model" with wind. They could have replaced this capacity with biomass for example, like what is happening in Edenderry Power Plant which would have resulted in much less emissions, thereby decreasing their final savings figure. It also could have been replaced by the replacement of HFO plant with CCGT plant, as in Great Island, which in that case, resulted in a net increase in capacity of about 200MW.
  2. The report states that "The total quantity of ramping in coal generation is higher with renewable electricity on the system. In contrast, gas CCGTs vary their output by a lesser amount with renewable electricity on the system." This is utter nonsense. You can have a look at the ramping profiles of CCGT plant here [Aghada] and here [Dublin Bay]. With more wind in the system, the ramping of gas plants is multiples of what it is in a system with little or no wind (as the only variable is demand).
  3. Number 2 also disproves the claim made that "Wind generation variability in 2012 was less than electricity demand variability". If this were the case, then the graphs linked above, would show the opposite, i.e. more ramping in the no wind or little wind periods or at least similar ramping but the difference is huge. Aghada CCGT's load profile for example has a flat surface in 2009 when there was only small amounts of wind compared to the jagged surface of 2013 when there was much more wind.
  4. The assumptions made on the inefficiencies of generators at different loads - Gas is responsible for 78% of the quantity of savings in the report. Most of that is made up of CCGT. To allow 200MW of wind in the system, a typical 400MW CCGT gas plant must drop to 200MW. This results in increased CO2 emissions of about 0.05- 0.07 tonnes per MWh, an increase of 20%. To allow more wind in, the efficiency drops further and CO2 emissions increase at a faster rate as explained here. So to allow 4,094GWh of wind in to create the assumed savings in the report, CO2 emissions would rise even more than 0.07 tonnes at times.  but they assume that "With the actual level of renewables on the system in 2012 (the Base Model case), the CO2 emissions intensity of fossil-fuel generators is 5% higher than in the No Wind Scenario." In reality, this would be higher, thereby eating into their savings figure due to wind.  
  5. Likewise there is an efficiency drop of 8% from 58% to 50% in the above scenario in Number 4. To allow more wind in, the efficiency drops further and at a faster rate. So to allow 4,094GWh of wind in to create the assumed savings in the report, the efficiency would most likely fall below 50% at times and even to 40% (a drop in efficiency of 18%). So the average efficiency of the CCGT plant is somewhere between 48%-52% (48% being a conservative base figure). This is a drop in efficiency of between 8% and 10%.  We are not told the efficiency figures they use. If higher efficiencies are assumed, then their fossil fuel saving figure is inaccurate.
  6. Perhaps the biggest flaw is their assumptions on reserve - and more importantly, replacement reserves, which increases when large amounts of wind are allowed into the system. A practical example is shown in a previous blog post here. You can see that CCGT plant had to be kept ticking over (just like a car left on and parked outside your house) to step in instantly as the wind dropped off. As this plant stepped in, replacement reserve needs to be made available in the event of a forced outage of another plant or indeed, a further drop in wind. Therefore, there tends to be a peak demand for reserves and replacement reserves at high levels of wind penetration. Let's look into this important matter in more detail:

The Impact of Wind on Reserve Requirements


 In a 2007 report, prepared for Eirgrid, titled "Wind Variability Management Studies (P.Meibom et al)" , Danish scientists and University researchers concluded that:
 "Generally, the demand for replacement reserves increases with
increasing wind power capacity installed.
The occurrence of high demands for replacement reserves is
mainly driven by a high number of simultaneous forced outages that happens
simultaneously to relatively high wind power or load forecast errors. The value of these peaks tends to increase with increasing wind power capacity installed."
In another study by R. Doherty and M. O’Malley of UCD Dept of Electronic and Electrical Engineering, titled “A new approach to quantify reserve demand in systems with significant installed wind capacity,” it was stated that :

The methodology is applied to a model of the all Ireland electricity system, and results show that as wind power capacity increases, the system must increase the amount of reserve carried or face a measurable decrease in reliability [i.e. increase the risks of a blackout - bloggers note].
[Note that in these reports, they assume that increased wind capacity (i.e. building more wind farms) will result in higher wind penetration in the system (i.e. higher levels of wind relative to demand)]

SEAI took no account in their study of the increased demand for reserves during periods of high wind penetration i.e. more plant burning fuel behind the wind. Instead, they took a fixed amount of reserves during the year based on the minimum amount of reserve permitted by the regulations :

Primary and secondary operating reserves are calculated dynamically in the model for each period based on 75% of the largest unit running at that time in RoI and the largest unit running at that time in NI. Tertiary reserve requirements are included as fixed quantities based on the largest single electricity in-feed. These were 425 MW in NI and 480 MW in RoI for the first 9 months of 2012 and 500 MW for the last 3 months of 2012 [SEAI].

Lets have a look at the Regulations :


That's right, this is the Minimum amount of reserve that must be maintained. It is then at the discretion of the TSO (Eirgrid) to increase this depending on circumstances.


Reserve requirements are not influenced by wind generation or other renewable electricity generators at current levels of installed capacity. [SEAI]

However, it was still possible that there could have been high levels of wind penetration in 2012 (which would have resulted in increased demand for reserves).
The All-Island grid study showed that additional reserve requirement in hypothetical 2020 scenarios is related to the amount of wind installed but that the largest contributing factor remains the loss of the largest conventional unit [SEAI].
The study SEAI are referring to is the same report by Danish scientists mentioned above. But what the study actually says in relation to this is :

There should be enough spinning reserves to cover an outage of the largest unit in combination with a fast decrease of the current wind power production. However, the capacity of the largest online unit changes dynamically. (Doherty and O’Malley 2005) further demonstrate the dependency of the demand for TR1 [Reserve Type 1] from the installed wind power capacity. 
SEAI also argue that the system in Ireland is flexible enough to accommodate fluctuations in wind anyway without the need for additional reserve. But as you can see in the example previously mentioned (see here), you can see where two CCGT plants, namely Huntstown and Great Island, stepped in from reserve to cover the loss in wind power on the 3rd November. None of the online plants were flexible enough or had enough spare capacity to provide this cover.

We can look at the impact of wind on reserve with a very simple example. Say, that we end up with a system, where 100% of the wind can be allowed in to meet 100% of demand and this occurs for a whole day. By the following day, 20% of the forecasted wind drops off, and then later in the day 50% of the remaining forecasted wind drops off. By the 3rd day, wind is only providing 5% of demand. Now let's pretend that we do what SEAI say we should do and maintain 480MW-500MW of reserve. Remember, Reserve requirements are not influenced by wind generation. As the 20% wind drops off, we will be able to call on the reserve by ramping up the reserve generators to full output to fill the gap. We must now put replacement reserve in place. Again, this is not affected by the wind so 500MW will do fine. But now we come to later in the day where circa 1,500MW wind has dropped off. We use some of our fast acting (but small capacity) units to try to fill the gap along with the other slower replacement reserve. But there is simply not enough of the slower acting, larger capacity reserve ready to step in. Time has run out and we are now facing Blackouts. So it is clear from this example, that you have to increase the minimum reserves to cover nearly every MW of wind in the system, thereby negating most, if not all, of the fossil fuel or CO2 savings (actually potentially increasing them because the back-up plant have to run on low loads). The wind, itself, in effect, becomes the largest in-feed unit. You can get away with lower reserves at lower levels of wind, but you simply can't take this risk at higher levels.

So, there is no debate on this - increasing wind penetration above a certain level, leads to an increase in reserves. I would put the line at 1,000MW in the Irish system, as now we have the equivalent of two large thermal plant that can drop out at any time and in any sequence and is much more likely to drop out than if they were in fact, two thermal plant. The exact amount can be debated but I will now come to a problem with the report, that presents a fundamental issue for those who are now using it to inform energy policy and public debate. It is there, written down exactly as quoted here, on Page 12, and can't be debated or argued over, or fudged, or ignored, or interpreted in some other fashion.

The main problem with this report is that it gets trotted out by SEAI and policymakers as the basis for installing more wind farms. But, like with previous SEAI reports, there is a huge disclaimer in it, that most people who have read it may well have missed. That is why I put it in bold above. But it deserves repeating and repeating again :


Reserve requirements are not influenced by wind generation or other renewable electricity generators at current levels of installed capacity


So I ask the question, why is this report, long outdated and now redundant, since it is based on 2012 levels of wind in the system, trotted out and used as justification for more wind farms when what it really is saying, just like all the other reports mentioned above, (albeit begrudgingly in this case) is that the integration of more wind in the system will require more fossil fuel reserves ?