Monday, 24 October 2016

Cold Winter Could Spell Disaster for EU's energy policy


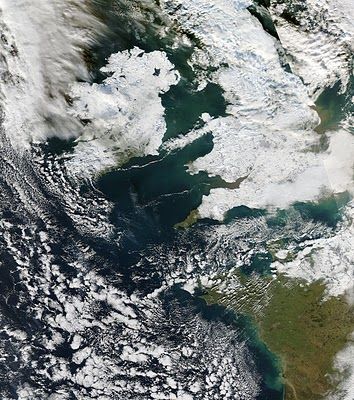
There are significant signs that a cold winter is on the way for Northern Europe. The Polar Vortex is notably very weak for this time of the year. This means a weak jetstream, eastern winds and a cold winter. During the previous two winters we had a strong jetstream and strong westerlies, which explains why they were so mild. The Polar Vortex looked very different at this time of the year to what it looks like now i.e. much stronger. While Europe had mild winters, America had cold severe winters :

http://www.independent.co.uk/news/world/americas/niagara-falls-freezes-incredible-pictures-show-falls-partially-frozen-as-polar-vortex-is-set-hit-us-10055691.html

Coupled with the current weak Polar Vortex is a projected negative Atlantic Oscillation. There were also signs of a cold winter back in August when heavy snow fell in Germany to an extent not seen since 2009.

The problem for Europe in the event of a severe winter is inadequate generation capacity. France will be shutting down five of its nuclear reactors over the coming months.  This creates a big problem because other countries that have invested heavily in renewables are dependent on French imports. 

Comparing the French grid for October 2016 Vs October 2015 shows up a change in imports / exports profile :


You can see that last year, France was exporting large amounts of power whereas this year it is exporting much less and indeed importing half of the time. Belgium has also been having problems with their nuclear fleet recently. Spain which was importing up to 2GW this time last year is now exporting most of the time. Germany are also full time net exporters. This can change if output from renewables declines in these countries.

A cold winter accompanied by high pressure and low winds will put the Energy Union to the ultimate test. 

Sunday, 9 October 2016

Valentia Observatory Records Record Rainfall


On October 4th, Valentia Observatory recorded it's highest level of rainfall in a single day since the station opened 150 years ago. There was 105.5mm of rain in 24 hours. The same station also recorded it's wettest September in 10 years and December 2015 was the wettest December on record.  However, May 2016 was a remarkably dry month, well below average.

  
To get the bigger picture to see what is going on, I've taken a look at mean air temperature records. 


Previous very wet years were 1924, 1930, 1946, 1947, 2002, 2008 and 2009. Is there a trend of floods and heavy rainfall occurring directly after years of warming ?

The past five years were cooler than the warming peak of the 2000's. We will have to see how 2016 plays out. So far, 2016 is over half a degree warmer than 2015 (up to September). This makes 2016 warmer than any of the last five years but still cooler than the 2000s. 

The sea surface temperature maps still show a large body of cool water out in the Atlantic :


Compare with 2006 and 2007 :


A colder Atlantic would normally mean a colder winter in Ireland. 


Monday, 3 October 2016

Curtailment Payments to Wind Farms will Increase Over Winter


From Irish Independent

The compensation will be based on the market price per megawatt of power produced, which is currently at around €50. If an operator could not transmit 100MW, they would be entitled to €5,000. "There is no doubt that at some stage over the coming months we will have to curtail," a source said.

The unavailability of the East West interconnector also means that Eirgrid will have to revise their Winter Outlook :


The capacity margin of 3199 shows how much spare capacity we have over and above demand. This can now be reduced to 2699 with the loss of the interconnector. The Danes generally assume that wind has a capacity credit of zero whereas Eirgrid assume a 14% figure for Irish wind. If we get a prolonged period of High Pressure, then the output of wind will be close to zero and will contribute nothing to adequate capacity. So that leaves a capacity margin of 2,266 MW. If the winter takes a sudden cold turn, then that will put added pressure on this margin as demand rises. 


Climate Saint Mary Robinson says "Eat Less Meat"


From Irish Independent


Meanwhile back in the real world, the skies over County Cavan, Ireland yesterday :


If you look closely, you can even spot Saint Robinson's plane on the way to Mayo.

Monday, 26 September 2016

Grid Costs Set to Rise to Meet 2020 Targets


Grid costs will cost households and businesses an additional € 354 million next year as part of a large rollout of grid and transmission networks. The Energy Regulator explains :

The five years from 2016 to 2020 will require continued investment in the transmission system and delivering ongoing infrastructure projects. The PR3 period was characterised by the initiation of a large scale infrastructure delivery programme in order to meet 2020 renewable generation targets

So the transition to the green economy doesn't involve dismantling of the existing fossil fuel system. Instead, it means adding capacity and grid infrastructure paid for by you and me. This is fast turning into a gravy train for whoever has the best idea for extracting more money from electricity bills, or in economic terms, a bubble. 

The same is happening elsewhere in Europe. In Germany, grid costs will soon rise by a whopping 45%-80% as network infrastructure struggles to keep up with all the additional capacity :

http://www.spiegel.de/wirtschaft/unternehmen/tennet-und-50hertz-erhoehen-netzentgelte-a-1113741.html

There is no going back now. We have committed ourselves to a crazy energy policy. No wonder the European Union is no longer as popular as it used to be.

Thursday, 22 September 2016

Rise in Ireland's Electricity Generation CO2 Emissions


SEAI have published the latest details on CO2 emissions in Ireland. Electricity generation emissions have risen in 2015 because of a rise in coal consumed in Moneypoint.


The graph is slightly misleading for a couple of reasons. It uses a simplified modelling system that doesn't take full account of increased cycling and ramping from back up generators. Hence the disclaimer on Page 26 :


There are clear limitations in this analysis but it does provide useful indicative results. 

The cycling effects are certainly not small as stated on Page 21 - see here for an analysis

http://euanmearns.com/co2-emissions-variations-in-ccgts-used-to-balance-wind-in-ireland/


In reality, the cycling effects increase as more wind is added so the CO2 per kWh of electricity may be fairly accurate back in say 2010 but starts getting progressively worse by 2015. 

The other problem is that by the end of 2012, the East West Interconnector was up and running sending Co2 free power to Ireland throughout 2013 and after that. This is because emissions are counted in the country of origin, in this case the UK. No account seems to be taken in the graph above of this. There is no Imports (avoided) in the legend.

Lastly, as stated recently on this blog, use of diesel generators is becoming more common with increased intermittent wind power, and is now at about 230MW capacity. I can't find any reference to them in the SEAI paper so presumably they are not included. 

Monday, 12 September 2016

Over 40% of Wind Energy Shutdown Last Night

by OWEN MARTIN

Last night, over 40% of wind energy produced was shutdown or curtailed during a spell of gale force winds across the island of Ireland. This episode clearly shows the limitations of relying too much on an intermittent source of energy like wind. Billions of euros worth of turbine installations become worthless at both low wind and at high wind.   

Figure 1


The reason for the shutdown of so many wind turbines can be clearly seen in the System Frequency charts before and after the wind shutdown. 

As the gales gathered in strength on Sunday evening, maintaining the frequency of the grid became more difficult :


Figure 2


The zig zag patterns in the Figure 2 show how frequency fluctuated between 49.9 and 50.1 Hz. The dips represent periods of too much wind when system inertia drops (due to lack of conventional generation such as coal or gas). Should frequency drop below 49.7 Hz then a blackout may occur, so Eirgrid rectified this by shutting down some of the wind and allowing more conventional generation into the system. The frequency then rises again to 50Hz. Gas turbines are forced to ramp up and down more often to maintain system stability during such periods thus pushing emissions up and negating some of the benefits of  having all the wind in the first place. 


Figure 3

Figure 3 shows what happened when over 40% of the wind output was shutdown and there was more manageable levels of wind, in this case about 1,500MW. The frequency is very stable and there is little risk of blackouts. This has been normality in the grid for many years. Compare it with Figure 2. This is the future. It will certainly test engineering skills to it's limits. Gas turbines will have to function under greater strain than before. It will cost a lot of money. There can no longer be a guarantee that the electric kettle will boil when you want it to. 

The other option Eirgrid have to maintain a stable frequency in these situations is to cut demand - which is in effect a blackout under another name. The future is renewable. The future is green. I'm at a loss to figure out how this is "progress".