Readers may have been following the ongoing debate between meteorologist Ray Bates and Peter Thorne of Maynooth University in relation to the most recent IPCC climate change report. The latest response by Ray can be read here. Some of it is quite technical but I want to focus on one part that any lay person can understand easily.
Prof. Thorne states: “Ray Bates goes on in his piece to imply nefarious intent behind the IPCC considering only the post-1960 series of GMST in their SPM figure. The choice is reasonable because the attribution statement in AR5 (and the prior figure) pertained to post-1950 changes. Furthermore, in the underlying chapter 1 Figure 1.2 the full series from 1850 is shown. The SR1.5 is hardly ignoring the early period as implied is it?”
My [Ray Bates] Reply:
In its Summary for Policymakers (SPM), SR1.5 did ignore pre-1960 temperature trends, as I stated. It is no defence of an omission in the SPM to point to a chart in the underlying report, the exclusion of which from the SPM is the whole matter at issue.
In Figure SPM.1, why was the obvious choice not made to show the post-1950 (corresponding to the period of the AR5 attribution statement) rather than the post-1960 changes? Prof. Thorne provides no explanation. Was the purpose to make it difficult for policymakers to see that cooling trends could occur while CO2 was increasing, as in the period 1950-1960?
This is the graph in question that was made for policymakers. You can see a clear warming trend and so there are no doubts that global warming is happening and CO2 is the cause.
 |
| IPCC graph starting in 1960 |
The issue at stake is why they decided to start from 1960 rather than 1950 or 1940 ? The answer can be seen in the very reliable temperature data at Valentia station in Co.Kerry (the red line below). Here, you can see a clear cooling trend from 1950 until 1980.
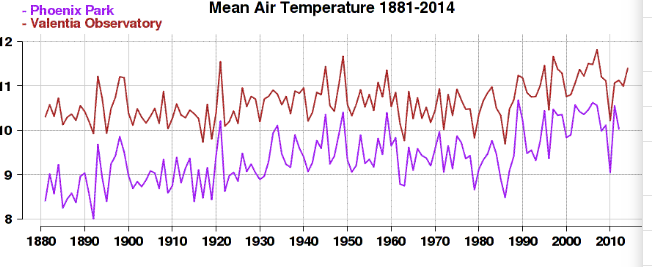 |
| Valentia temperature record in red |
In the IPCC graph, see close up below, you can just about make out the tail end of this cooling period from 1960-1980 in the grey line but it isn't distinct enough to undermine the overall warming trend drawn in bright red and orange. If they had started from 1950, the cooling trend would be much more clear and they couldn't have shown the red line rising from the beginning of the graph. Instead, they would have needed to show a cooling trend preceding the runaway warm trend.
 |
| IPCC graph close up |
This would have given the impression as Ray Bates points out that cooling trends could occur while CO2 was increasing.
Leading to the inconvenient conclusion that CO2 does not always contribute to warming and that there are other factors, apart from CO2, that control the climate.
I don't have a problem with the development of new ideas, new products or the preservation of essential industries from the short term ravages of market forces. I don't have a problem with government warning and acting on dangers which may lie ahead. In my lifetime the government had a huge programme to help citizens cope with nuclear fallout. In most of these cases the cost was low and even where they are higher (such as farm subsidies) the money quickly found its way down to useful employment and purposes. Farmers pay sales tax (VAT) on their supplies.
ReplyDeleteTax on fuel was based on the fact that fuel was an inelastic good for which there was no alternative. High fuel usage indicated a high performing economy. Nowadays, taxes on fuel is based on the assumption that either there are alternatives or the good is elastic or both. How can a good like fuel be inelastic in 1989 and elastic in 2019 when there are no alternatives to it? How can an economy perform when there is no fuel to power it? The answer is that the purpose of the carbon tax is to collect money for government to spend. In Ireland the media and voters keep a close eye of each political parties spending proposals and is suspicious of spending plans without tax plans. Climate change is an ideal way around this. Dress it up as saving the planet and off they go. In fact the Irish government has promised to use the carbon tax to increase children's allowance, a clear appeal to the women's vote. It is just possible that after years of hype, failed wind farms and other green extravagance, that voters wake up to the fact that they will be poor. The Yellow Vest protests in France and the rise of popular politics in the USA and Europe may be (just my be) evidence of that happening.
It seems the most creative thing that politicians and government are capable of is continually raising taxes until of course breaking point is reached...'Retreating in the face of yellow vest demands is proving to be a costly exercise. The government says the total bill of conciliatory climbdowns so far will be around €10bn.
DeleteThat includes around €6bn for Mr Macron's new measures announced on Monday and the estimated loss of €3.9bn the government will no longer levy from its now abandoned carbon tax hike on fossil fuels.' (11/12/2018 Breaking News)
https://www.breakingnews.ie/world/macron-measures-to-quell-french-protests-will-cost-10bn-891413.html
It was co2 from the atmosphere that went into producing carbon based fossil fuel now being burned. The IPCC ignored the Roman and Viking warm periods which would show the current very slight warming is cyclical. There is no raw data published from Arctic or Antarctic weather stations, It is very expensive and difficult to keep them operational. Many have been shut down this century having been previously been recording.
ReplyDeleteThe exception is Cape Norris Jessop weather station in Northern Greenland http://rp5.co.uk/Weather_archive_in_Cape_Morris_Jesup The average temperature for the 6th January 2019 (yesterday) was minus 25 degrees C. There is no record for the same day in 3005, but there is for 1st February, 2005 and that was a 9 degrees warmer. Those in a position to influence policy makers are not being honest.
And more recently there's been the global warming slowdown, pause, hiatus!
ReplyDeletehttp://www.thegwpf.org/after-el-nino-will-the-global-warming-pause-continue/
https://judithcurry.com/2016/02/24/nature-making-sense-of-the-early-2000s-warming-slowdown/
https://www.nature.com/articles/nclimate2938.epdf?