Thursday, 24 January 2019

Decrease in PSO Levy


Most people may have noticed by now a decrease in the PSO levy in recent electricity bills. However, what you might not have noticed is that the unit charge increased from 15.74 cent in May 2018 to 16.72 cent by September, pretty much negating the savings from the PSO. 

As the graph below shows, this is the largest and steepest increase in the unit charge during the past seven years. So as per usual in Ireland the drop in the PSO Levy has not been passed on to most consumers.


Thursday, 17 January 2019

Gemma O'Doherty on the Wind Energy Scam


Gemma O'Doherty seems to be the only journalist in Ireland who's willing to take on subjects that run counter to current ideology in Ireland. Her ability to produce new videos has been restricted recently so I would advise readers to view her video on wind energy while it is still available.

Sunday, 13 January 2019

2018 Only 1% Warmer than Average


With all the recent talk in the Irish media about the climate catastrophes of 2018, it's worth noting that very few commentators and "experts" make reference to the actual temperature data for last year. In this article, I have compiled the temperature data for all the rural weather stations in Ireland. These stations would not be affected by the urban heat island effect so are more reliable than stations in airports and cities. 

The result shows that the average (mean) temperature for the period 1981-2010 was 10 degrees. The average for 2018 was just above that at 10.14 degrees, an increase of just 1.4%. This is a long way away from the two degree increase doomsday scenario often touted by climate alarmists which would require an increase of 20% in the average temperature. 


Rural Stations
Mean Temp 1981-2010
Mean Temp 2018

Athenry
9.9
9.8

Ballyhaise
9.6
9.5

Belmullet
10.2
10.1

Claremorris
9.4
9.6

Dunsany
9.3
9.7

Finner
9.7
9.9

Gurteen
9.6
9.9

Johnstown
10.2
10.4

Mace Head
10.7
10.6

Malin Head
9.7
9.8

Markee
9.6
9.3

Moore Park
10
10.4

Mt Dillon
9.4
9.5

Mullingar
9.2
9.5

Newport
10.3
10.5

Oak Park
9.8
10.4

Roches Pt
10.7
11

Shannon
10.7
10.8

Sherkin Island
11.1
11.1

Valentia
10.8
10.9


Mean
10.0
10.14
0.14 degrees


1.4%
Reference : Met Eireann Monthly Data

Saturday, 5 January 2019

Ray Bates and Peter Thorne Debate

By Owen Martin

Readers may have been following the ongoing debate between meteorologist Ray Bates and Peter Thorne of Maynooth University in relation to the most recent IPCC climate change report. The latest response by Ray can be read here. Some of it is quite technical but I want to focus on one part that any lay person can understand easily.


Prof. Thorne states: “Ray Bates goes on in his piece to imply nefarious intent behind the IPCC considering only the post-1960 series of GMST in their SPM figure. The choice is reasonable because the attribution statement in AR5 (and the prior figure) pertained to post-1950 changes. Furthermore, in the underlying chapter 1 Figure 1.2  the full series from 1850 is shown. The SR1.5 is hardly ignoring the early period as implied is it?” 

My [Ray Bates] Reply:
In its Summary for Policymakers (SPM), SR1.5 did ignore pre-1960 temperature trends, as I stated. It is no defence of an omission in the SPM to point to a chart in the underlying report, the exclusion of which from the SPM is the whole matter at issue. 
In Figure SPM.1, why was the obvious choice not made to show the post-1950 (corresponding to the period of the AR5 attribution statement) rather than the post-1960 changes? Prof. Thorne provides no explanation.  Was the purpose to make it difficult for policymakers to see that cooling trends could occur while CO2 was increasing, as in the period 1950-1960? 

This is the graph in question that was made for policymakers. You can see a clear warming trend and so there are no doubts that global warming is happening and CO2 is the cause. 

IPCC graph starting in 1960

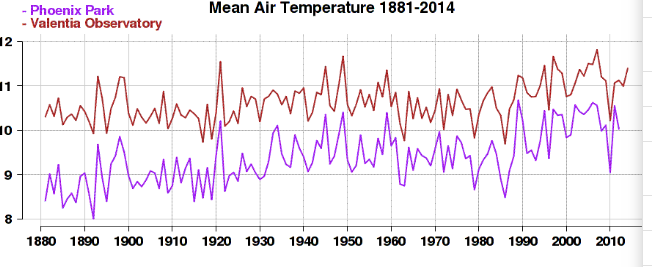
The issue at stake is why they decided to start from 1960 rather than 1950 or 1940 ?  The answer can be seen in the very reliable temperature data at Valentia station in Co.Kerry (the red line below). Here, you can see a clear cooling trend from 1950 until 1980. 


Valentia temperature record in red


In the IPCC graph, see close up below, you can just about make out the tail end of this cooling period from 1960-1980 in the grey line but it isn't distinct enough to undermine the overall warming trend drawn in bright red and orange. If they had started from 1950, the cooling trend would be much more clear and they couldn't have shown the red line rising from the beginning of the graph. Instead, they would have needed to show a cooling trend preceding the runaway warm trend. 


IPCC graph close up  


This would have given the impression as Ray Bates points out that cooling trends could occur while CO2 was increasing. 

Leading to the inconvenient conclusion that CO2 does not always contribute to warming and that there are other factors, apart from CO2, that control the climate.