The below post is intended for debate purposes only and conclusions are based on evidence made publicly available. I do not have access to any commercial sensitive data or other data not made publicly available that can confirm the following conclusions.
An interesting element of the current energy policy is that, with all the new wind farms scattered around the country, the demand for power has risen among our generating fleet, whilst in the other sectors of our economy it has decreased. The power used from the grid by generating units is known as house load or parasitic power.
We can show how much parasitic power is now potentially been used by our wind turbine fleet by looking at data from Eirgrid on a windless day(s). During these days, wind turbines will often used grid power to continuously turn their naccelle to face the direction of any small gusts that may arise in the area. This is in contrast to a strong windy day, where the prevailing wind will be coming from one direction, so the nacelle will remain fixed in that direction for as long as the weather system lasts. They also use grid power in calm cold conditions to ensure that the blades don't freeze.
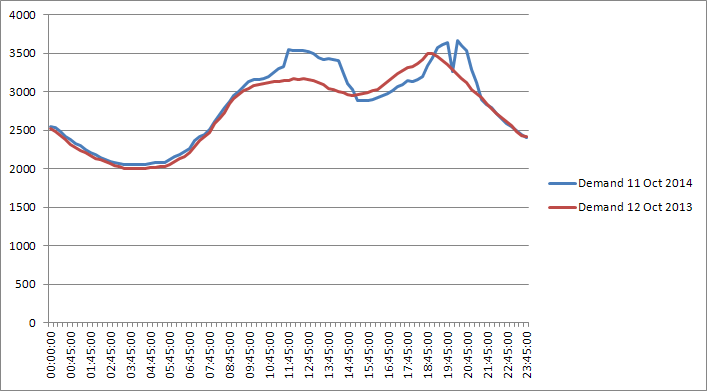
To demonstrate this, first of all lets look at the demand profile for two periods of 4 days (Friday to Sunday) in October 2013 and October 2014. Each trough and crest represents one day.
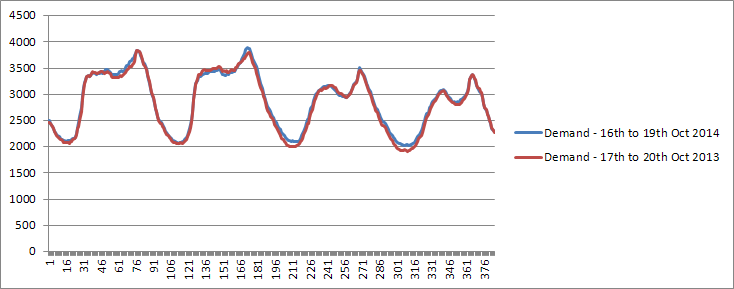
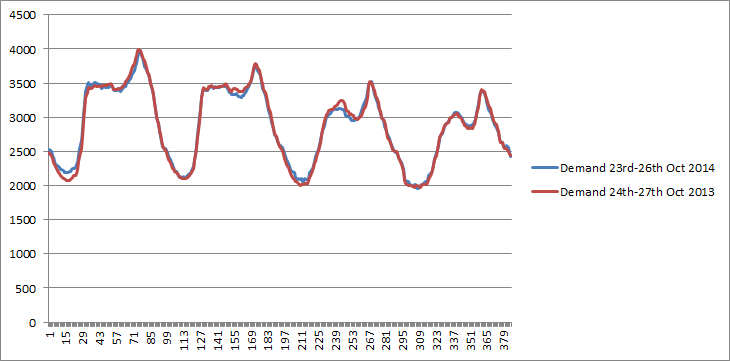
As expected, the demand is identical for both years. The first two weekdays in both years reach nearly 4,000MW at peak, and at the weekends reach about 3,500MW. There are no large industries that have relocated here in the meantime, nor any serious economic upturns, or booms, that could result in larger demand for this year. Ireland's economy is still sailing along in post-recessional / bailout mode. By the way, we wouldn't be expecting any large energy intensive industry to have relocated here because of our soaring electricity prices but that's another story. Here is another period with the same type of profile:
Wind generation was average to good during the above periods. Now, let's look at the wind generation profile from the previous period :
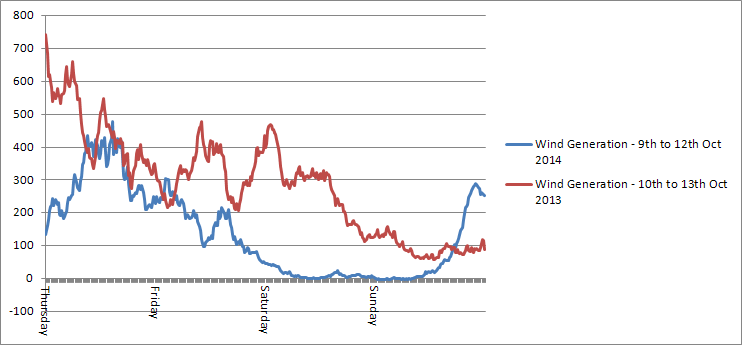
The blue line shows that this year, the wind output was particularly poor, even reaching minus 3MW on occasions. The part we need to focus on is the second half of that graph, which covers the Saturday and Sunday when the wind was crawling along between -3MW and 10MW in 2014. We would expect that the wind fleet would have been using grid power during this time to try to pick up any gusts and that this power consumption would be much larger than in 2013. So lets look at the demand profile for these days:
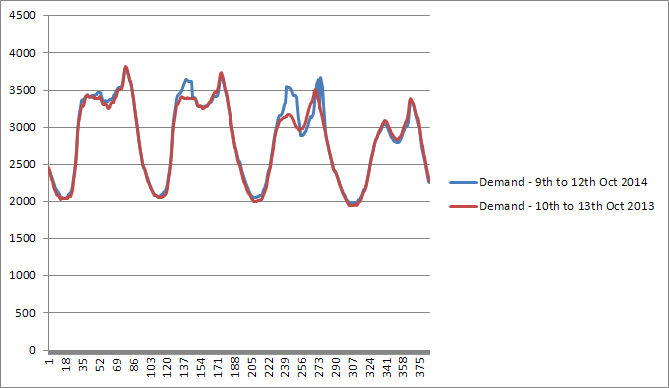
On the first and last days (Thursday and Sunday), we can see the demand profiles are very similar but in the case of Thursday, the wind output is much the same for both years. On Friday, the wind begins to deviate towards lower outputs and we see a spike in demand. But this could also be attributable to a larger load from industry on Friday morning. Then on the Saturday, we see two spikes in demand - one of about 400MW and the other about 200MW. We are now back at weekday levels of demand, which is odd because the factories and offices are closed down just like any other weekend. These spikes on Saturday fit in nicely with the wind graph above, where by Saturday afternoon, the wind was non existent, and the wind turbines were struggling to pick up on any gusts. As they did this, they consumed quite large amounts of grid power. The amounts are actually quite shocking and unexpected. On Sunday, it appears that they gave up on trying to use grid power (which indicates that they are charged for it) to start the turbines.
Let's look at that Saturday demand profile in more detail :
There is slightly less demand from about 3pm to 7pm but I can't see how wind turbines could have used less power in 2014, since there were more of them, so it is most likely attributable to something else, perhaps load shedding. When we extract the data where the demand is higher - from 9am to 3pm and 7pm to 10pm - we arrive at a figure of 1,906MWh for total additional power consumed from the grid by the wind farms during this calm day (assuming all of it is due to wind turbine fleet). This doesn't include parasitic power used on average wind days which is not possible to see with this data. So the 1,906 MWhrs refers to grid power consumed only on very calm days when the wind fleet are trying to catch gusts and maintain standby power (i.e keep oil and parts warm etc). There are around 1,124 wind turbines in Ireland so it works out at 1.7MWh per turbine.
To put this in context, the average 4 bed house requires approx 6.8MWh per year. So the power consumed over 9 hours by our total wind fleet in Republic of Ireland was the equivalent of the power required for 280 four bed houses for a whole year or 102,000 four bed houses for one day.
A week later the IWEA were telling us how much power their wind farms had generated (they hit a record) but we never get told how much power they consume, particularly on very calm days.
What are the associated emissions from this extra demand for grid power and how is it possible to say that wind energy is "zero carbon" ?
It is important to state that I accept that I cant prove with certainty that all or some of this additional demand is directly related to parasitic consumption of wind energy but given that 2013 and 2014 demand profiles are generally a perfect fit (as above) and that this variation occurred on a weekend day when there is less scope for variation (factories closed etc), it is difficult to attribute the variation to any other factor. But of course, comments are welcome.
This is some pretty terrible data analysis.What's the significance of using four days out of an entire year for comparison? It looks like your source has data for every day (well, not quite for 2014 yet). Even ignoring that short time period though, this isn't the right way to deal with the data.
ReplyDeleteA better method would be to plot the difference in electrical demand between 2014 and 2013 against the difference in wind supply between the same two dates, which I have done in this picture (see link. If it doesn't open full screen then right click, view image):
http://i41.photobucket.com/albums/e297/Psycho_Raptor/NoCorrelation_zps8f5c3ead.png
The correlation you claim just isn't there. Also see the (almost) full year of data:
http://i41.photobucket.com/albums/e297/Psycho_Raptor/NoCorrelationAll_zps7d5d8e5e.png
Also, you say "it is difficult to attribute the variation [in demand] to any other factor", which is not true, many things can vary between years that would affect grid demand, especially when only four days are being compared. Temperature is one example, but considering that you focus particularly on 11th Oct 2014, and use Irish data, some of the demand variations could be due to the Ireland-Gibraltar football match that day.
1) It is very important to pick days from the month that is been analysed. No point in comparing demand profiles from February when October is been analysed. That is why 2 periods of Thurs - Sun were taken from the month that the poor wind performance occurred in. If I didnt do this, I would be accused of picking days that suited the conclusions.
ReplyDelete2) Your graphs do not tell us what occurred in the above period. Of course there were days where wind farms did not use huge amounts of grid power e.g. if the price for same was too high. This is not in dispute. The question is what occurred on the 11th October.
3) Temperature records from Phoenix Park show mean temps of 11.9C for 12/10/2013 and 12.17C for 11/10/2014 during the hrs 9am-3pm. Also, Valentia shows a higher min temp and max temp for 2014. So temperature isnt the cause. Anyway, you wouldnt expect it to be a factor between these hours. It would be a factor after 5-6pm. So it is possible that it was a factor during 7-10pm but the two horned spikes that occurred here dont make sense if it was.
4) As for it been the football match, Im afraid this most definitely isnt the cause. Kick off was at 5pm and the match went on till 6.30pm. Demand actually dropped during this period !
1) I know that you picked the same four days in each year. But why only four days? Were there only four days of poor wind performance in the year?
ReplyDelete2) On my graphs, the large, negative differences in the power supplied by wind (i.e. extreme left of the graphs) represent times in 2014 when energy production was much less than in 2013. If more power is consumed when there is less generation, then the data should be correlated, and slope upwards to the left. It does not. If you insist on only looking at one day, then here is the same graph comparing just 11/10/2014 and 12/10/2013:
http://i41.photobucket.com/albums/e297/Psycho_Raptor/NoCorrelationOne_zps752f662e.png
There is still no correlation, the difference in energy consumption between the two days does not generally increase as the difference in wind generation increases.
3 & 4) I gave those as temperature and football as two possibilities because you said "it is difficult to attribute the variation [in demand] to any other factor". Had you considered temp and sport before my comment? What other factors have you considered?
1) + 2) I have not made a claim that demand increases linearly when wind output is low
Delete3) I considered both. A sport game would not have resulted in such a large surge in consumption. Temp doesnt fit with time of day as I have said. I may have missed something though I accept that. Somebody working in the industry could point us in right direction but if my conclusions are right we wont hear anything.
You said:
Delete"the wind output was particularly poor, even reaching minus 3MW on occasions... We would expect that the wind fleet would have been using grid power during this time to try to pick up any gusts and that this power consumption would be much larger than in 2013".
In other words you claim that there should be more demand when the wind output is poor - that is a correlation. You didn't say linear, but nor did I. I did say "slope", but I meant "general increase" (I did also use that phrase in my last comment). In my graphs, including in the one day plot, there is no general increase in the difference in energy consumption as difference in wind generation gets larger. The data doesn't backup your claim.
Also, you used the demand data from Eirgrid as found here:
Deletehttp://www.eirgrid.com/operations/systemperformancedata/systemdemand/
which actually states that it does *not* include demand from generators themselves. So you won't be able to find how much the generators use from that data.
The supply data for Eirgrid does seem to go negative sometimes, so that allows the net energy supplied to, and taken from, the grid to be calculated by numeric integration. I get 4.6 TWh of energy delivered to the grid between 01/01/2014 and 13/12/2014, and only 10.5 MWh consumed* during the same period. The net production is still 4.6 TWh (to one decimal place).
And see Val Martin's comment for figures from an AIE request, which put the total energy consumption during 2012 by wind generators at 40 GWh. This compares to the total energy generation by wind generators in that year of 16 TWh (400 times more than the consumption). The generation figure is calculated (by me) as if the generators were running at maximum capacity all year, which is clearly not true, but there's still going to be a net generation when there's a factor of 400 to eat into.
* from the grid anyway. The real consumption will be higher when the energy required was being supplied by the wind generators themselves.
You are right that Eirgrid shows net of generators requirements. But on 11th Oct it is a different situation. Eirgrid can estimate the house load every day very easily but they cant estimate it for a day like the 11th when the wind fleet may have been using much larger amounts of grid power than normal. This would have shown up on their demand profiles as it would have diverged significantly from the normal house load. You need to be able to differentiate between normal house load and what *possibly* happened on the day in question.
DeleteStill no explanation forthcoming for what happened on the 11th October
DeleteDoes the Erigrid website say those things somewhere? I can only see the bit about how it doesn't include generator requirements.
DeleteI don't know what happened on 11th October. Clearly there was something different compared to the same day on the previous year, but there's no evidence linking the extra demand to the lack of wind. Using the whole data set does not pick out the link because there isn't one. There's no correlation, my graphs in previous comments show that. Cherry picking one day, then saying "I don't know why it's different, so it must be X" is not a good way to work.
Here is another day in 2014 where (unlike in 2013) there was no wind:
http://i41.photobucket.com/albums/e297/Psycho_Raptor/2014oneDay_zpsbc1c20e3.png
Demand is pretty much identical, there are very slight differences in both directions, but mostly the same.
Here is a day in 2004 where again, there is no real wind, but there was in 2003. Despite that, 2003 had a slightly higher demand:
http://i41.photobucket.com/albums/e297/Psycho_Raptor/2004oneDay_zps619421a1.png
The day before that, wind was pretty similar in both years, and so was demand. If anything, the times when 2004 was less windy, with a negative power output, correspond to times when there was less demand:
http://i41.photobucket.com/albums/e297/Psycho_Raptor/2004oneDay2_zps8529c214.png
This video might help and is the best investigation I could make in 2011.
ReplyDeletehttps://www.youtube.com/watch?v=abl_6mrSUqM&list=UUDylOm1eqwfMynNpaM0SpPQ
From an AIE request the Republics wind farms consumed 40,065 mega watt hours of grid power in 2012.
ReplyDeleteHi Val Martin, that's 40065 MWh of *energy* during the course of one year (2012), to run wind turbines with a *power* capacity of 1850 MW, correct?
DeleteUsing your numbers: if those turbines ran at full capacity for the entire year, they would produce 58 PWh of energy. That's about 1.5 million times more energy than the electricity they consumed from the grid. Of course, it's unlikely they'd run at the full 1850 MW all year, but 1.5 million factor is so huge that it's pretty clear how big the net generation effect is.
Ah I think I made a really big mistake there, sorry! The energy produced is much less than I said, it's actually only 16 TWh. That's still around 400 times more than the electricity consumed from the grid though, so again, still good net generation even if they didn't operate at full capacity.
Delete
DeleteThanks Val for that info. Its quite a large amount. The analysis shown on my blog refers to one day where an extraordinary deficit of wind was experienced and the inference is that they used much larger amounts of parasitic power than normal. So it wouldnt make sense to take my figures and multiply by 365. They would use alot less on an average day.
I note from the comments on your video that you found out they were charged for the electricity which my analysis seems to agree with.
*Anonymous* You need to work off a 28-30% CF.
This is all interesting, but largely academic. If they wind farms use parasitic power they pay for it so it comes off the bottom line, or am I mistaken.?
ReplyDeleteOf more interest is the payments the wind farms get when they are not actually producing electricity, either because it's too windy or not windy enough. I haven't been able to figure out how these payments are calculated, is there a source for this information.
There is some info on the UK news papers, however there doesn't seem to be anything with regard to Irish constraint payments.
Hi, not sure if this is the same Anonymous as above. The Minister recently stated that curtailment payments last year for wind farms was €7.5 million. Its usually between 2.5 to 3.5% of power produced. See Eirgrid Curtailment Reports.
DeleteWhen the wind is below cut in speed, they still get paid capacity payments for making their capacity available. Info available at semo website.
The first question which springs to mind is why are we guessing? If you check out any industry accounts the amount and cost of electricity power used will be there in black and white. I allege that the entire payment scheme for wind turbines is kept deliberately complex to stop us finding out. It appears to be a "kind of make it up as you go along" accounting. At the Green Paper event in the Ballsbridge Hotel, an official from the DCENR said (in the presence of Minister White" they were too complex and needed reviewing, 40,065 mwh is enough to power 9,500 family homes, enough to power a town the size of Drogheda which I predicted in my videos before receiving the information.
DeleteDifferent Anonymous. Thanks for that.
ReplyDeleteIt must be remembered that there is no recognized way to measure the real contribution of wind generated electricity on a grid system. My videos are an attempt to quantify it with access to the most important date denied. This is at the behest of the wind industry with connivance of government. Remember house power is drawn every minute of every day, while load factor is about 25% only. Multiplying wind capacity capacity factor does not take account of the cost of accommodating wind on the grid. This is a hidden cost paid for by the consumer. Wind can never displace base load plant and can never be allowed exceed 50% of total. The ESB use credit capacity in their 2004 report and Eirgrid replicate this method in their 2010 - 2016 adequacy report. Capacity Credit decreases with increased penetration of wind and according to the ESB tends to zero. Experience world wide is that wind does not displace conventional plant when measured over one year and its contribution is in the order of 2% at high levels. At these figures, parasitic power would tip contribution into negative, meaning more not less fossil fuel is consumed because of wind
ReplyDeleteAdmin, you need a system of identification similar the the Popes or British Kings. viz: Pope Richard 11, Richard the 111 or King Benedict V!!! or IX with all these Anonymous es LOL
ReplyDeleteTo say that the amount of wind energy you produce in a year is the same as how much wind energy is consumed, is the same as saying that if you have an old clapped out car and you fit a 4,000 litre fuel tank to it and fill it up with fuel, then you can be sure the car will keep motoring until the fuel is gone! This type of measurement is not used in any other facet of life. My videos explain this. By the way EU regulations on renewable energy state that the measurement must be by the amount of renewable energy consumed which is a laughable idea. Wind energy is a novelty, a niche and my videos show how it is a waste of effort. Countries with the highest wind are Denmark and Germany, they have the highest electricity prices in the world with no reduction in emissions. So if wind worked, they would be boasting about it. Sad after all that was spent on education. Some blame computer games for muddling young minds. To me explaining this is like telling an old Dublin man what a double decker bus is.
ReplyDelete