Showing posts with label Fossil fuel savings. Show all posts

Monday, 4 May 2020

Fuel Consumption 2012 to 2018 - the Good, the Bad, and the Ugly


In the course of the transition we will gradually reduce our dependence on the fossil fuels – coal, peat, oil and gas – that currently dominate our energy mix - Alex White, Energy Minister, White Paper, 2015


Despite massive efforts to reduce carbon emissions and fossil fuel dependence by successive Irish governments, the efforts have largely proven a failure, as fossil fuel consumption rose by 15% between 2012 and 2018. The government placed an overemphasis on wind energy as the solution, which doubled in capacity during that time to 3,600MW. Demand may also have increased, which in of itself is a failure to reduce consumption habits, and an over emphasis on the generating of electricity. Demand could have been tackled through retrofitting, promotion campaigns aimed at reducing consumption, moving away from the GDP standard, encouraging saving rather than spending (central bank have been doing the opposite), and preventing population growth by curbing immigration.

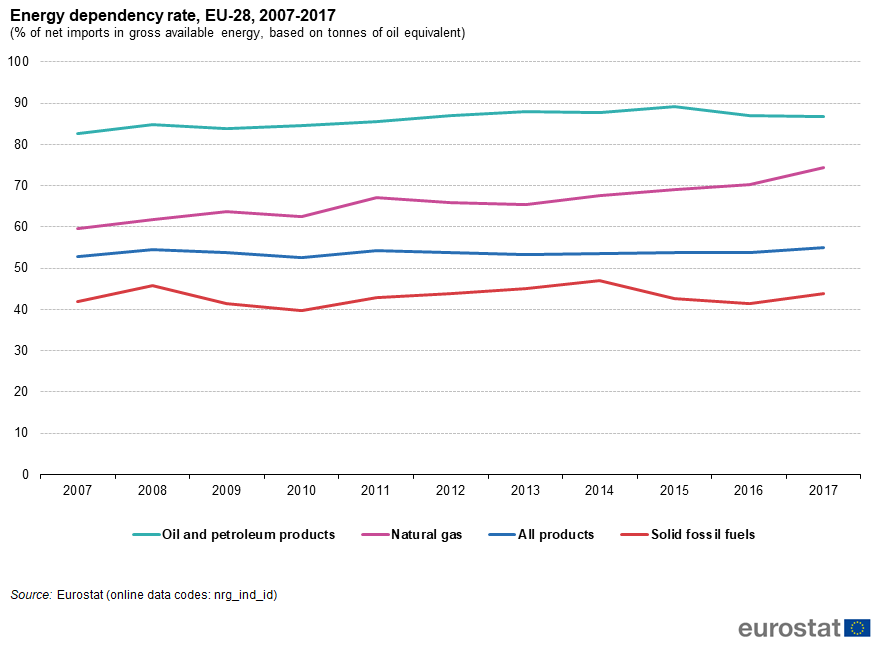
The main driver of the increase was petroleum products, including natural gas (used in power stations), which has risen by about 20%.


Natural Gas increased by 20%
In 2012, gas generated half of our electricity, as it did again in 2018, but this time with a significantly higher gas consumption. When your car comes off the motorway and goes into ‘stop start’ urban driving it burns more fuel, just like power plants forced into such operation, as intermittent wind energy pours on and off the grid.   


In their favor, coal and peat decreased by 23% and 8% respectively. The reduction in these, contrary to the common held belief, was due to several factors  - an increase in gas, oil, renewables and electricity imports from the UK (the East West Interconnector began operation in late 2012).  The US achieved a 27% reduction in CO2 emissions during the period 2008 to 2017 by simply switching from coal to gas. So too emissions savings in Ireland arise from switching from coal to gas, a lower emitting fuel,  and importing electricity from the UK, where the resulting emissions are counted, and after that, renewables make up the rest of the savings.  


Peat decreased by 8%


For gasoil and diesel we can see that not only has dependence on transport risen, but  oil used in power generation has also, quite remarkably, increased. Much of this increase is due to an oil powered station in Kerry (Tarbert) which ran more in the grid, presumably because of the closures at Moneypoint. There are also more demand side units, which comprise of diesel generators.


We can also see that we are more addicted to air travel than ever, as jet kerosene consumption doubles. How could a virus pandemic ever be prevented from reaching our shores ?

So we have to ask the question, why are we still consuming high amounts of fossil fuels, after installing so many wind turbines ?  Media reports that show that a high percentage of our electricity came from wind fail to mention what we actually saved as a result. If I cycle from Dublin to Galway, but a car follows me all the way, what have I actually saved ? It is obvious now that they are not a long term solution to reducing dependence on fossil fuels. 

In 2020, there is still, regrettably, peat being used in electricity production, although there is an issue about the impact on employment in the midlands region that has still not being resolved. The renewables industry, as we now know, is not a big employer. 

The Energy Bubble


Generating Capacity for the Republic of Ireland, we have over twice as much as we need

The above graph shows how an energy bubble has been created in the past decade. Whereas in 2006, at the height of the building boom, we only needed enough generating capacity to cover 1.3 times the peak demand, we now have 2.4 times the capacity required. Peak demand levels in 2019 are the same as 2006 levels. All this capacity has to be paid for either through the market or from subsidies that are added on to energy bills. New fossil fuel plant are also in the pipeline.

The Cost 


The EU publishes an energy price report every two years. The last year available of full data is 2016; which shows a circa €490 billion bill for energy sources, €212 billion being imported fossil fuels, plus an additional tax squeeze of €280 billion, of which €76 billion in subsidies is for the renewable sector equating to €208 million per day or €150 from each citizen.

€48 billion was paid directly to wind and solar generators on top of the market price for generating 13% of EU’s electricity mix. 

The market price plus tax paid to gas and solid fuel generators, for generating 41% of the EU's electricity mix, were also €48 billion. 

Turkeys would not vote for Christmas if they were able to educate themselves.


Sunday, 19 April 2020

EU Fossil Fuel Imports have Increased

Surprise, Surprise - The Renewables Program has Failed

One might expect that after installing all this renewable energy, that European Union countries would be importing less fuel. But the failure of their ideologically driven energy policies can now be understood by this simple graph. Gas imports are well up, and even oil and coal are slightly higher as compared to 2007. If the ultimate goal is to "divest" from fossil fuels , then we have got no further on. Perhaps it's time to do a proper cost benefit analysis before we go any further?


Monday, 23 September 2019

ESB Profits show that Wind Energy has not Reduced Reliance on Fossil Fuels

ESB operate most of the fossil fuel powered generators in Ireland. Their gas, peat and coal generating plants amount to about 3,400 MW. Hydro about 400MW and wind about 450MW. So about 80% of their generation is from fossil fuel sources.

Given that Ireland now has in total about 3,500MW of wind, we should, if the wind energy supporters are right, see wind energy eroding profits in ESB generation.

But their latest results show that their Generation and Trading business has increased it's profits by    € 26 million to € 70 million. Although there was lower running in Moneypoint, this was more than offset by a higher margin in gas plants

A breakdown of this profit is not given, but we can safely assume that most of it came from fossil fuel generation since that comprises 80% of their business as I have shown above. It is indicative that during the same period, there was an impairment charge (i.e. a write down) of €1.8 million for a wind farm.

So almost a decade on from Ireland's Renewable Energy Action Plan which stated that :

Renewable energy reduces dependence on fossil fuels, improves security of supply, and reduces greenhouse gas emissions creating environmental benefits while delivering green jobs to the economy, thus contributing to national competitiveness. 

 we can now see that wind energy does not reduce dependence on fossil fuels, rather, it maintains dependence on it.

Wednesday, 22 November 2017

Oil and Coal Imports Rise Since Irish National Renewable Energy Action Plan

In 2010, Ireland introduced it's National Renewable Energy Action Plan. One might have expected a reduction in fossil fuel imports since that time but in fact both oil and coal imports have risen. Only gas imports have declined. 


ktoe
ktoe

Imports 2016
Imports 2010


Crude
3,270
3,113
Gasoline (petrol)
795
1,098
Kerosene
520
530
Jet Kerosene
1,122
1,068
Fueloil
60
316
LPG
136
122
Gasoil DERV
2,684
2,278
Bitumen
230
299
Total Oil 9,009
8,957


Coal bituminous
1,084
921
                     Source: SEAI Energy Data


In the case of oil, most of the increase is due to an increase in motor cars. The increased coal imports are been used in Moneypoint Power Station and are a consequence of the price of coal having dropped since 2010.


What this proves is the madness of Ireland's wind only policy which can only displace gas, the least emitting fossil fuel. If we really are in trouble with the climate, then converting Moneypoint to either gas or nuclear is the only solution in town.  Which of course nobody really wants to look at and that tells you something.


Natural Gas Imports


As for gas imports, these have declined. Some of that is due to the 3,000MW of wind energy. Other equally important factors are the Shell gas reserve off the sea at County Mayo which came into production in 2016 (which in fact accounts for about 80% of the reduction), the new interconnector to the UK which up to recently was providing a net import into Ireland and an increase in peat and coal production. Gas imports have in total declined by 60% or 11% if Shell gas reserve is excluded.

Although there was a reduction in gas used in the residential sector, there was an increase in gas used in the industrial sector. In particular, the metals industry and behind that the foods industry.


Friday, 19 May 2017

Does Wind Energy Provide A Good Return on Investment for the Consumer ?

by Owen Martin

When we spend money to have our electricity generated by wind, how much are we saving on not having to import fossil fuels ? One might expect that € 1.00 spent on wind is € 1.00 less that has to be spent on fossil fuels. 

In 2015, wind energy received € 426 million in energy payments. Energy payments are what generators receive daily in the electricity market and are normally set by the price of gas. On top of this, wind receives a subsidy from the PSO Levy. For 2015, this amounted to about     € 85 million. Wind also receives 7% of its revenue in capacity payments so about € 35 million and 5% of wind energy has to be shut down for security reasons for which they receive about € 20 million in curtailment payments.  

 That's a total of € 566 million in direct payments to wind generators. 

According to the SEAI, wind energy displaced € 233 million in fossil fuels for 2015. That means that we have to spend € 1.00 on wind energy to replace 40 cents worth of fossil fuels. If we include the increased grid and system costs to accommodate all this wind, then of course the savings are even less than that. 

It's not the best value for money for the consumer but for greens value for money is not a priority and for the wind companies of course it provides a great return to shareholders.


REFERENCES

1) SEMO total energy payments for 2015 equals € 1.8bn

http://www.sem-o.com/pages/MDB_ValueOfMarket.aspx

Wind provided 23% of electricity according to SEAI, this means wind received € 426 in energy payments.

http://www.seai.ie/Publications/Statistics_Publications/Energy_in_Ireland/Energy-in-Ireland-1990-2015.pdf

2)  PSO Levy for 2015 :

https://www.cer.ie/docs/000967/CER14361%20PSO%20Levy%20Decision%20Paper%20%202014-15%20(New).pdf

Assumed that wind made up 90% of PSO payments to renewables.


3)  "Capacity payments accounted for between 7% (for wind) and 30% (for peaking plants) of generators’ revenue in 2013".

http://ireland2050.ie/questions/what-are-capacity-payments/

426m + 85m = 511 / 93% = 549m  * 7% = 38m

4)  "In Ireland, the dispatch-down energy from wind resources was 348 GWh: this is equivalent to 5.1% of the total available wind energy". 

http://www.eirgridgroup.com/site-files/library/EirGrid/Annual-Renewable-Constraint-and-Curtailment-Report-2015-v1.0.pdf

Based on what wind received in energy payments ( €426m / 6823GW = € 62.40 MW/hr) they received roughly € 21m in curtailment payments ( 348GW * €62.40)


Saturday, 22 April 2017

Emissions Rise at Ireland's Power Stations Despite €6 Billion Investment in Wind Energy

One of the things consistently pointed out on this blog is that no matter how much wind energy you deploy, you can never shutdown a single power station. Those who advocate for more wind are slowly realizing this as more facts come out. 

Last year (2016), electricity demand in Ireland rose by about 2.3%.  An additional 600MW of wind was added to the system but the capacity factor (a measure of the annual output from wind farms) fell from 33% to 27%. Also during 2016 the limit on the amount of wind allowed into the system at any one time (non synchronous penetration) was raised from 50% to 55% and then at the end of the year to 60%. 

According to reports by the EPA, emissions and fuel consumption increased in eight out of the eleven power stations for which records were available for 2016. 

Six of these power stations were operated by gas, the other three by oil. Poolbeg (gas), Tarbert (oil) and North Wall (gas) power stations had the largest rises in emissions. Aghada (gas) and Tarbert (oil) power stations had the highest emissions since 2011, while Rhode power station (oil) had the highest since 2007.


Power station
Emissions Increase 2016 Vs 2015
Highest Emissions Since
Fuel Type
Aghada
72%
2011
Gas
Huntstown 2
19%
2013
Gas
Poolbeg
366%
2014
Gas
North Wall
249%
2013
Gas
Great Island
61%
Commissioned in 2015
Gas
Tynagh
70%
2014
Gas
Tawnaghmore
14%
2010
Light Fuel Oil
Tarbert
240%
2011
Heavy Fuel Oil / Light Fuel Oil
Rhode
93%
2007
Light Fuel Oil

Note the three oil run power stations at the bottom all had the highest emissions for many years.

Factors that lead to these increases were :

• The interconnector to the UK was out for four months at the end of 2016. This would partly explain the increases in Dublin power stations such as Poolbeg and North Wall.

• Electricity demand increasing by 2.3%. With new data centres on the way, demand will soon increase by much more than that. 

• Capacity Factor of wind dropping from 33% to 27%. It's an unfortunate fact that no matter how many wind farms there are, if there is no wind, you get no energy. Storage wont fix this problem either as the original energy source is still intermittent wind energy that can remain flat for months on end during periods of high pressure.

• The low price of oil and gas. 

• The low capacity credit of wind energy. Ireland now has 3,000MW of wind, but all these wind turbines cannot replace a single power station. All the power stations must remain on standby. An additional 600MW of wind was added in 2016, roughly a 25% increase on 2015. The only solution for this is nuclear. A nuclear power station can fully replace an existing power station and hence achieves much greater and much more consistent fuel and emissions savings in the long run than wind ever can.

How ironic that Ireland is now dependent on oil again for it's electricity needs after spending close to €6 billion on wind technology and another billion or two on grid upgrades to accommodate this wind. If this is not an indictment of the wind program, then I don't know what is.

Sources :

1) EPA Environmental Reports

http://www.epa.ie/terminalfour/ippc/index.jsp

2) Eirgrid Renewable Energy Curtailment Report 2016

http://www.eirgridgroup.com/site-files/library/EirGrid/Annual-Renewable-Constraint-and-Curtailment-Report-2016-v1.0.pdf

3) Cost of wind is estimated to be €2 million per MW installed.  


Sunday, 29 May 2016

New Report : The Reduction in Gas Savings Due to Wind Energy 2012 to 2015


BY OWEN MARTIN
MAY 2016

EXECUTIVE SUMMARY


  • Ireland increased it’s wind generation by 11% between 2012 and 2013. This resulted in additional gas savings of 7%, a saving of 360 m3 of gas per MW of wind installed during 2013.
  • Between 2013 and 2015 wind generation increased by 44%. This resulted in additional gas savings of 16%, a saving of 160 m3 per MW of wind installed during 2014 and 15.  
  • This means that over double the wind farms had to be installed during 2014 and 2015 to achieve the same fossil fuel savings as in 2013.
  • The expected fossil fuel savings from high levels of wind energy do not materialize because back up plant are forced to run more inefficiently.
  • Without large levels of hydro to connect to as in Denmark, gas powered stations will be forced to run less efficiently negating most of the savings from wind.
  • At some point, the high costs associated with installing more wind energy will outweigh the increasingly diminished benefits (saturation point).
  • It is likely that we are approaching that point now.
  • The Irish Government needs to place a moratorium on wind energy until a full assessment is carried out on other options.


INTRODUCTION


Most commentators in the energy debate here in Ireland assume that 1MW of wind energy displaces equivalent fossil fuels required to generate 1MW of conventional power in the electricity system. Last year, wind energy contributed 23% to the electricity generation fuel mix[1]. The conventional view is that this resulted in equivalent fossil fuels savings and associated CO2 emissions. The problem with this view is that it ignores back up plant having to run less efficiently during high penetrations of wind. Joe Wheatley was among the first to question the conventional view in his 2012 paper[2]. Up until 2014, this was the stated position of SEAI, the agency set up by the Irish government to advise them on renewable energy. Then in 2014, SEAI issued a report which claimed to include all of the inefficiencies in the grid from high penetrations of wind energy[3]. In 2016, a report prepared by Danish researchers showed quite clearly that back up gas plant (CCGT) ran more inefficiently during high penetrations of wind[4]. This resulted in increased specific CO2 emissions and fuel consumption during these periods.

This report now examines precisely what the gas savings were for the years 2012 to 2015. The EPA publish annual gas consumption figures for Ireland’s CCGT and OCGT. Due to omissions in the 2014 data, that year will be left out of this report and I will only look at 2012, 2013 and 2015. This omission does not have any bearing on the results.

No analysis like this has been carried out for Ireland’s electricity system since large scale wind energy was deployed. It is based on real data from the power stations rather than models. Most, if not all reports on wind energy use models which, while instructive, may not reflect all factors which this report will include such as reserves. The analysis refers to the Republic of Ireland only and does not include Northern Ireland as the two systems are not connected.

IRELAND’S GAS GENERATOR FLEET - CCGT AND OCGT


It is widely agreed that wind energy mainly replaces gas in Ireland’s electricity system.
Gas is consumed in either Combined Cycle Gas Turbines (CCGT) power stations or in their less efficient relations Open Cycle Gas Turbines (OCGT). There are eight CCGT power stations and nine OCGT in Ireland. Generally, CCGT run more frequently than OCGT which are mainly used for peaking. Some OCGT use oil instead of gas.

Gas consumption data for the CCGT in Aghada are not separated from the OCGT situated at the same site so it is not possible to show separate results for both CCGT and OCGT. Therefore, the figures for gas in this report are a combined OCGT / CCGT figure.  

No data was available for the two OCGT at Sealrock, however these run as baseload (they have priority dispatch) so again the omission of these gas power stations doesn’t have any bearing on the results as they will run similar each year. Likewise, there is no recent data available for the two OCGT at Edenderry but these run on oil anyway.

So this report will include the three OCGT at Aghada, Marina OCGT and North Wall OCGT. So does the inclusion of these not affect the overall conclusions as some will argue that it is CCGT which back up wind rather than OCGT ? Well, the answer is No. Bord Na Mona, who operate the two OCGT at Edenderry state the following [5] :
  • There is a need for flexible thermal units with fast response times to complement the increasing amount of wind capacity on the Irish electricity network

OCGT are far more flexible and respond much quicker than CCGT and therefore they are a necessity during high periods of stochastic wind penetration. For this reason OCGT are often used as reserve and replacement reserve. A report prepared by Eirgrid in 2007 stated the following [6] :

  • "Generally, the demand for replacement reserves increases with increasing wind power capacity installed.

  • The occurrence of high demands for replacement reserves is mainly driven by a high number of simultaneous forced outages that happens simultaneously to relatively high wind power or load forecast errors. The value of these peaks tends to increase with increasing wind power capacity installed."

So OCGT should be included in a study of this kind to get an accurate picture of actual gas savings due to wind. As it turns out, two of the OCGT (at Aghada) had increased running during 2015 while the other three had reduced running.

There was one new CCGT commissioned during this period - Great Island in the South East in 2014. This replaced an old heavy fuel oil power station. It’s important to note that the old station only ran between 4 and 6% of the time whereas the new station ran approx 50% of the time in 2015. Along with increased wind generation, this surely contributed to the lower running of neighbouring CCGT in the South Region and / or lower electricity imports. For the purposes of this report it is assumed that Great Island contributed to lower electricity imports in 2015.

DEMAND, COAL AND ELECTRICITY IMPORTS


Demand increased by about 1 TW during the period 2012 to 2015 (Figure 1) [7].
Imports increased in 2013 (from zero) and decreased in 2015 [8]. Coal output dropped slightly in 2013 but increased to it’s highest level since 2007 in 2015 [9].

FIGURE  1

Presumably, this was due to the flood of cheap American coal in the market, a consequence of the fracking boom.

GAS SAVINGS DUE TO ADDITIONAL WIND ENERGY


During this period, wind energy grew from about 4,000 Gw to 6,500GW, an increase of 60%. Gas consumption in Ireland’s power stations fell from approx 2.2 billion m3 to 1.8 billion m3, a reduction of 20% (Figure 2).

FIGURE 2

The objective of this report is to calculate the year on year (or marginal) gas savings, taking all of the above factors from Figure 1 and 2 into account, from the additional wind added to the system each year.

THE YEARS 2012 TO 2013


To accurately calculate this, the East West Interconnector (EWIC) must be taken into account. The EWIC came into operation at the very end of 2012 and because of it’s location generally displaces generation in the Dublin region. Between 2012 and 2013, although demand did not fall, gas consumed in the four Dublin CCGT fell by 11%, about 166 million m3. However, it is assumed that for 2013 that Huntstown 2 reduces it’s output when EWIC is exporting to Ireland with the other reductions in Dublin due to wind energy [10]. Gas consumption in Huntstown 2 fell by 105 million m3 between 2012 and 2013.

Because the EWIC was running in 2013 and not in 2012, it means that an adjustment is required in 2013 for the reduced running of Huntstown in the system. This means that actual gas savings due to increased wind energy between 2012 and 2013 was not 267 million m3 as per Figure 2 but instead 162 million (267m less 105m). So a 446GW increase in wind output (or 11%) during 2013 resulted in additional gas savings of 162 million m3 or 7% [Figure 3].

So for each GW of additional wind, an additional 360,000 of gas was saved or in megawatt terms, 1MW of wind energy added during 2013 resulted in savings of 360 of gas.


FIGURE 3

Note: There was reduced coal output and increased demand in 2013 but there was more than sufficient surplus EWIC imports after accounting for the reduced Huntstown capacity factor to cover these.


THE YEARS 2013 TO 2015


We now proceed to the years 2013 and 2015. The first point to note is that the EWIC is now in operation for both years but an adjustment is still required for the reduced imports during 2015. Secondly, demand increased by approx 0.7TW but it was assumed that this was met by increased coal generation also of 0.7TW [Figure 1]. There was no increase in other renewables worth talking about [11].

Great Island came into operation during 2014 and it is assumed that this, along with higher levels of wind, resulted in the lower imports of 0.7TW [12]. Great Island had an increase in output and gas consumption of 1.2TW and 244 million m3 respectively. This meant that 1m3 of gas gave an output of 0.52MWh. I have decided to work on the conservative side and attribute all of the lower imports to the increased generation from Great Island. This means that 136 million m3 of the total gas for 2015 can be attributed to the lower imports [13].    

Without this adjustment gas savings for 2015 are 180m m3 compared to 162m m3 saving in 2013 for a 44% increase in wind generation. Quite clearly an adjustment is required for the lower imports which have been replaced by gas generation. Otherwise, I would be understating the gas savings due to wind.

Figure 4 shows the actual savings due to wind. After the above adjustment, gas savings are 316m m3 (180+136), about double the savings made in 2013 although for four times as much additional wind energy.


FIGURE 4


So we have gone from 1GW wind for Gas saving of 360,000 m3 to 1GW wind for Gas saving of 160,000 m3. We now have to install twice the amount of wind farms to achieve the same fossil fuel savings as achieved before. [Figure 5].

FIGURE 5

Clearly, the CCGT are frequently running on low loads, behind the high levels of wind, well below the rated output that they were designed to run at. They are also cycling more often. This has lead to significant inefficiencies and lower fossil fuel savings as more wind is added to the system.

Another contributing factor is the requirement for five large power stations to be on load at all times to maintain voltage control [14].  The majority of these are CCGT. So these power stations can’t be shut down during long periods of high wind. Also, it’s possible that reserves and replacement reserves have increased due to increased wind generation further reducing fossil fuel savings.

One can see from Figure 5 that we are soon reaching a saturation point of wind energy. This is the point at which installing an additional MW of wind will result in net gas savings of zero. At the same time, the costs of installing this extra wind will increase with additional grid requirements and increased maintenance costs of CCGT [15].

This report does not include changes in the generating mix since large scale deployment of wind energy. For example, off grid diesel generation capacity (known as Demand Side Units) now stands at 230MW, a 40% increase on the previous year [16]. There was a 6% increase in oil consumption at Ireland’s power stations between 2013 and 2015 [17].


CONCLUSION


Clearly, the CCGT have run more inefficiently since 2013 due to the large increase in wind generation.

Generating 23% of electricity from wind, whilst a good achievement on paper, does not result in equivalent fuel and associated CO2 savings of anywhere near that. Going from a wind penetration of 17% (2013) to 23% in 2015 has resulted in fossil fuel savings of 0.16 million m3 per GW of additional wind, yet when we moved from 15% (2012) to 17% (2013) there were savings of over twice as much (0.36 million m3 per GW of wind). Clearly, the fossil fuel savings are decreasing exponentially with each new MW of wind installed.

The Irish government’s commitment to wind energy needs to be re-assessed in light of the above findings. Most of the significant fossil fuel savings from wind energy have already been achieved. Without a hydro back-up system such as Norway to connect to, the savings from each new wind farm diminish until the costs clearly outweigh the negligible benefits. Running gas power stations behind high levels of wind does little to de-carbonise Ireland’s economy or reduce it’s dependence on fossil fuels in the long term.

If the job of the Irish wind energy industry is to put the fossil fuel industry out of business, then based on this analysis, it will ultimately fail.

A moratorium should be placed on all new wind energy installations until a full analysis of all options and alternatives is carried out.


APPENDIX


Data taken from EPA Annual Environmental Reports for each power station

CCGT gas m3
2012
2013
2015
Whitegate
393,983,401
372,753,001
373,780,327
Aghada*
216,863,106
200,399,000
166,506,742
Huntstown 1
159,248,430
53,382,667
152,473,676
Huntstown 2
409,214,575
303,262,382
214,937,721
Dublin Bay
464,000,000
507,364,976
525,303,400
Poolbeg
477,552,311
479,309,499
48,088,267
Great Island
0
0
244,241,797
Tynagh
127,461,818
77,930,162
100,400,478


TOTAL CCGT
2,248,323,641
1,994,401,687
1,825,732,408

*Aghada includes 3 OCGT of 90MW each, 430MW CCGT and steam turbine of 260MW steam turbine all run on gas (just small amount of light fuel oil is used)

OCGT gas m3
2012
2013
2015
Marina
6,869,000
2,746,700
35,642
North Wall
19,267,431
10,068,560
1,724,892


TOTAL OCGT
26,136,431
12,815,260
1,760,534


TOTAL CCGT/OCGT
2,274,460,072
2,007,216,947
1,827,492,942


Source: SEAI

2012
2013
2015
WIND GWh
4,101
4,547
6,569


[6] Wind Variability Management Studies (P.Meibom et al) 2007
[9] All coal figures in this report come from Moneypoint Annual Environmental Reports
[11] There was 5MW increase in biomass which replaced peat and only 10MW of solar PV.
[12] EWIC had lower imports of 713,000 MW. Given the fuel / mw ratio of 0.52% for Great Island, 713,000 / 0.52% = 136 million m3 of equivalent gas attributable to EWIC
[13] Great Island is now the most efficient gas generator on the grid hence why it would make sense for it to run alongside lower imports http://www.independent.ie/regionals/newrossstandard/news/power-onwexfords-330-million-power-plant-goes-live-at-great-island-31177277.html
[17] From EPA  Annual Reports for each power station